BB&T 2010 Annual Report Download - page 102
Download and view the complete annual report
Please find page 102 of the 2010 BB&T annual report below. You can navigate through the pages in the report by either clicking on the pages listed below, or by using the keyword search tool below to find specific information within the annual report.-
 1
1 -
2
-
3
-
4
-
5
-
6
-
7
-
8
-
9
-
10
-
11
-
12
-
13
-
14
-
15
-
16
-
17
-
18
-
19
-
20
-
21
-
22
-
23
-
24
-
25
-
26
-
27
-
28
-
29
-
30
-
31
-
32
-
33
-
34
-
35
-
36
-
37
-
38
-
39
-
40
-
41
-
42
-
43
-
44
-
45
-
46
-
47
-
48
-
49
-
50
-
51
-
52
-
53
-
54
-
55
-
56
-
57
-
58
-
59
-
60
-
61
-
62
-
63
-
64
-
65
-
66
-
67
-
68
-
69
-
70
-
71
-
72
-
73
-
74
-
75
-
76
-
77
-
78
-
79
-
80
-
81
-
82
-
83
-
84
-
85
-
86
-
87
-
88
-
89
-
90
-
91
-
 92
92 -
 93
93 -
 94
94 -
 95
95 -
 96
96 -
 97
97 -
 98
98 -
 99
99 -
 100
100 -
 101
101 -
 102
102 -
 103
103 -
 104
104 -
 105
105 -
 106
106 -
 107
107 -
 108
108 -
 109
109 -
 110
110 -
 111
111 -
 112
112 -
113
-
114
-
115
-
116
-
117
-
118
-
119
-
120
-
121
-
122
-
123
-
124
-
125
-
126
-
127
-
128
-
129
-
130
-
131
-
132
-
133
-
134
-
135
-
136
-
137
-
138
-
139
-
140
-
141
-
142
-
143
-
144
-
145
-
146
-
147
-
148
-
149
-
150
-
151
-
152
-
153
-
154
-
155
-
156
-
157
-
158
-
159
-
160
-
161
-
162
-
163
-
164
-
165
-
166
-
167
-
168
-
169
-
170
-
171
-
172
-
173
-
174
-
175
-
176
-
177
-
178
-
179
-
180
-
181
 |
 |

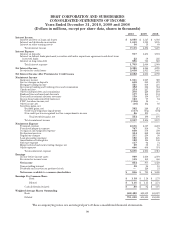
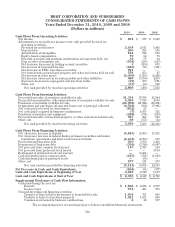
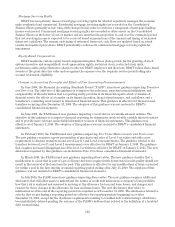
BB&T CORPORATION AND SUBSIDIARIES
CONSOLIDATED STATEMENTS OF CASH FLOWS
Years Ended December 31, 2010, 2009 and 2008
(Dollars in millions)
2010 2009 2008
Cash Flows From Operating Activities:
Net income $ 854 $ 877 $ 1,529
Adjustments to reconcile net income to net cash provided by (used in)
operating activities:
Provision for credit losses 2,638 2,811 1,445
Depreciation 260 225 198
Amortization of intangibles 122 114 100
Equity-based compensation 79 62 75
Discount accretion and premium amortization on long-term debt, net 32 57 94
Gain on sales of securities, net (554) (199) (107)
Net decrease (increase) in trading account securities 3(260) 633
Net increase in loans held for sale (620) (31) (591)
Net decrease in FDIC loss share receivable 921 ——
Net writedowns on foreclosed property and other real estate held for sale 576 253 47
Net increase in other assets (2,006) (1,058) (2,264)
Net increase (decrease) in accounts payable and other liabilities 689 (3,390) 4,233
(Increase) decrease in segregated cash due from banks (39) 109 (171)
Other, net (57) (63) 132
Net cash provided by (used in) operating activities 2,898 (493) 5,353
Cash Flows From Investing Activities:
Proceeds from sales of securities available for sale 31,334 17,074 21,044
Proceeds from maturities, calls and paydowns of securities available for sale 6,049 7,918 4,539
Purchases of securities available for sale (26,598) (21,924) (36,234)
Originations and purchases of loans and leases, net of principal collected (4,594) (392) (7,894)
Net cash (paid) received for divestitures (832) 27 —
Net cash (paid) acquired in business combinations (7) 4,475 311
Purchases of premises and equipment (428) (174) (219)
Proceeds from sales of foreclosed property or other real estate held for sale 967 404 143
Other, net 88 (175) (13)
Net cash provided by (used in) investing activities 5,979 7,233 (18,323)
Cash Flows From Financing Activities:
Net (decrease) increase in deposits (6,843) (2,901) 11,325
Net (decrease) increase in federal funds purchased, securities sold under
repurchase agreements and short-term borrowed funds (2,434) (2,756) 151
Proceeds from long-term debt 500 3,758 5,436
Repayment of long-term debt (336) (3,749) (6,867)
Net proceeds from common stock issued 110 2,727 160
Net proceeds from preferred stock issued —— 3,134
Retirement of preferred stock and warrant —(3,201) —
Cash dividends paid on common stock (415) (727) (1,019)
Cash dividends paid on preferred stock —(93) —
Other, net 277 111 273
Net cash (used in) provided by financing activities (9,141) (6,831) 12,593
Net Decrease in Cash and Cash Equivalents (264) (91) (377)
Cash and Cash Equivalents at Beginning of Year 2,649 2,740 3,117
Cash and Cash Equivalents at End of Year $ 2,385 $ 2,649 $ 2,740
Supplemental Disclosure of Cash Flow Information:
Cash paid during the year for:
Interest $ 1,868 $ 2,126 $ 2,937
Income taxes 972 431 730
Noncash investing and financing activities:
Transfer of loans held for investment to loans held for sale 1,604 731 668
Transfer of loans to foreclosed property 1,521 1,551 600
Common stock issued in business combinations 240 197
The accompanying notes are an integral part of these consolidated financial statements.
102