BB&T 2010 Annual Report Download - page 90
Download and view the complete annual report
Please find page 90 of the 2010 BB&T annual report below. You can navigate through the pages in the report by either clicking on the pages listed below, or by using the keyword search tool below to find specific information within the annual report.-
 1
1 -
2
-
3
-
4
-
5
-
6
-
7
-
8
-
9
-
10
-
11
-
12
-
13
-
14
-
15
-
16
-
17
-
18
-
19
-
20
-
21
-
22
-
23
-
24
-
25
-
26
-
27
-
28
-
29
-
30
-
31
-
32
-
33
-
34
-
35
-
36
-
37
-
38
-
39
-
40
-
41
-
42
-
43
-
44
-
45
-
46
-
47
-
48
-
49
-
50
-
51
-
52
-
53
-
54
-
55
-
56
-
57
-
58
-
59
-
60
-
61
-
62
-
63
-
64
-
65
-
66
-
67
-
68
-
69
-
70
-
71
-
72
-
73
-
74
-
75
-
76
-
77
-
78
-
79
-
 80
80 -
 81
81 -
 82
82 -
 83
83 -
 84
84 -
 85
85 -
 86
86 -
 87
87 -
 88
88 -
 89
89 -
 90
90 -
 91
91 -
 92
92 -
 93
93 -
 94
94 -
 95
95 -
 96
96 -
 97
97 -
 98
98 -
 99
99 -
 100
100 -
101
-
102
-
103
-
104
-
105
-
106
-
107
-
108
-
109
-
110
-
111
-
112
-
113
-
114
-
115
-
116
-
117
-
118
-
119
-
120
-
121
-
122
-
123
-
124
-
125
-
126
-
127
-
128
-
129
-
130
-
131
-
132
-
133
-
134
-
135
-
136
-
137
-
138
-
139
-
140
-
141
-
142
-
143
-
144
-
145
-
146
-
147
-
148
-
149
-
150
-
151
-
152
-
153
-
154
-
155
-
156
-
157
-
158
-
159
-
160
-
161
-
162
-
163
-
164
-
165
-
166
-
167
-
168
-
169
-
170
-
171
-
172
-
173
-
174
-
175
-
176
-
177
-
178
-
179
-
180
-
181
 |
 |
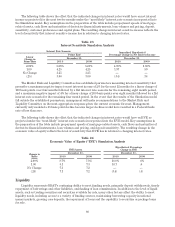
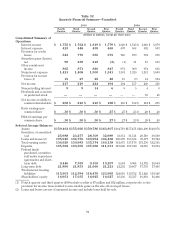
loans serviced for third parties, totaled $83.6 billion at year-end 2010 compared to $73.6 billion at December 31,
2009. The Residential Mortgage Banking segment experienced a net loss of $46 million in 2010, compared to net
income of $206 million in 2009. This decline was primarily due to a significant increase in the economic provision
for loan and lease losses. Net income in 2009 increased by $76 million, or 58.5%, as a result of strong growth in
loan originations during the year.
Net interest income for the Residential Mortgage Banking segment totaled $326 million in 2010, down 5.0%,
compared to $343 million in 2009. Net interest income in 2009 was up 13.2% compared to 2008. The decrease in net
interest income in 2010 was primarily the result of a decline in average portfolio loan balances. The increase in net
interest income in 2009 was primarily the result of growth in the loans held for sale portfolio and associated lower
funding costs.
The economic provision for loan and lease losses was $570 million for 2010, up $237 million, or 71.2%,
compared to $333 million in 2009. Growth in the provision reflected higher losses in 2010, including $141 million of
net charge-offs as a result of the sale of problem loans in connection with management’s nonperforming asset
disposition strategy.
Noninterest income in the Residential Mortgage Banking segment declined $150 million, or 24.7%, to $457
million in 2010. This decrease is due to lower residential mortgage production revenues compared to a record year
in 2009. Noninterest income was up $383 million, or 171.0%, in 2009 compared to 2008. Higher mortgage
originations, as well as improved economic hedge performance of the mortgage servicing asset, were primary
responsible for this increase. Noninterest expenses incurred in 2010 within the Residential Mortgage Banking
segment increased $23 million, or 18.0%, to $151 million compared to 2009, primarily reflecting higher foreclosed
property expense, as well as an increase in provision expense associated with loan repurchases. Noninterest
expenses for 2009 were up $44 million, or 52.4%, as compared to 2008, primarily due to higher incentives related
to strong sales performance, as well as higher loan origination costs.
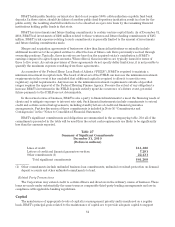
Total identifiable assets of $22.2 billion for the Residential Mortgage Banking segment increased $3.1 billion,
or 16.4%. This followed a slight decrease in identifiable assets in 2009. Increases in mortgage loans were due to
growth in loans held for investment by year-end 2010.
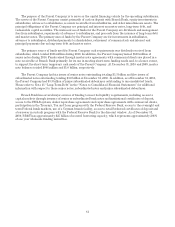
Sales Finance
Net income from the Sales Finance segment was $37 million in 2010, up from a net loss of $12 million in 2009.
This increase is primarily attributable to growth in average loan balances and a significantly lower economic
provision for loan and lease losses. Net income for 2008 was $19 million.
Net interest income from the Sales Finance segment increased by $22 million, or 17.6%, to $147 million in
2010 compared to 2009. The increase in net interest income was primarily due to record loan production and an
improved net interest margin during a lower interest rate environment. During 2009, net interest income
increased by $5 million, or 4.2%, to $125 million compared to 2008. This increase was due to growth in the indirect
recreational and marine vehicle portfolio, as well as the acquisition of an indirect automobile loan portfolio in
mid-2009.
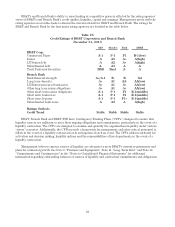
The economic provision for loan and lease losses of $34 million was down 62.2% in 2010 after a 125.0%
increase to $90 million in 2009. The decrease in 2010 reflects lower loan loss rates as a result of lower early
defaults and improved auction results.
The Sales Finance segment was assessed referral fees of $13 million in 2010 and 2009 to compensate
Community Banking for services. Noninterest expenses incurred within the Sales Finance segment increased by
only 3.2% to $32 million in 2010 due to slowing problem loan-related activities after increasing 10.7% during 2009.
Allocated corporate expenses decreased by $3 million, or 25.0%, in 2010 compared to previous years.
Total identifiable assets for the Sales Finance segment of $6.8 billion increased $683 million, or 11.1%,
compared to 2009, reflecting the strong growth in lending activities coming off of a prior year increase of $14
million, or 0.2%.
90