BB&T 2010 Annual Report Download - page 17
Download and view the complete annual report
Please find page 17 of the 2010 BB&T annual report below. You can navigate through the pages in the report by either clicking on the pages listed below, or by using the keyword search tool below to find specific information within the annual report.-
 1
1 -
2
-
3
-
4
-
5
-
6
-
 7
7 -
 8
8 -
 9
9 -
 10
10 -
 11
11 -
 12
12 -
 13
13 -
 14
14 -
 15
15 -
 16
16 -
 17
17 -
 18
18 -
 19
19 -
 20
20 -
 21
21 -
 22
22 -
 23
23 -
 24
24 -
 25
25 -
 26
26 -
 27
27 -
28
-
29
-
30
-
31
-
32
-
33
-
34
-
35
-
36
-
37
-
38
-
39
-
40
-
41
-
42
-
43
-
44
-
45
-
46
-
47
-
48
-
49
-
50
-
51
-
52
-
53
-
54
-
55
-
56
-
57
-
58
-
59
-
60
-
61
-
62
-
63
-
64
-
65
-
66
-
67
-
68
-
69
-
70
-
71
-
72
-
73
-
74
-
75
-
76
-
77
-
78
-
79
-
80
-
81
-
82
-
83
-
84
-
85
-
86
-
87
-
88
-
89
-
90
-
91
-
92
-
93
-
94
-
95
-
96
-
97
-
98
-
99
-
100
-
101
-
102
-
103
-
104
-
105
-
106
-
107
-
108
-
109
-
110
-
111
-
112
-
113
-
114
-
115
-
116
-
117
-
118
-
119
-
120
-
121
-
122
-
123
-
124
-
125
-
126
-
127
-
128
-
129
-
130
-
131
-
132
-
133
-
134
-
135
-
136
-
137
-
138
-
139
-
140
-
141
-
142
-
143
-
144
-
145
-
146
-
147
-
148
-
149
-
150
-
151
-
152
-
153
-
154
-
155
-
156
-
157
-
158
-
159
-
160
-
161
-
162
-
163
-
164
-
165
-
166
-
167
-
168
-
169
-
170
-
171
-
172
-
173
-
174
-
175
-
176
-
177
-
178
-
179
-
180
-
181
 |
 |
ŠEffectively managing through the credit cycle
ŠResidential real estate risk / risk of deterioration spreading to other asset classes
ŠIntense competition for best credits within the financial services industry
ŠCost and risk associated with the regulatory initiatives
ŠOver-capacity in financial services industry
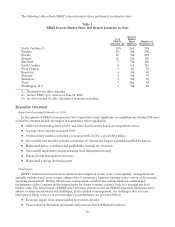
Overview of Significant Events and Financial Results
The operating environment for financial holding companies continued to be difficult during 2010, as the
economy continued to deal with the aftermath of the deepest global recession in decades. BB&T continued to
perform relatively well compared to peers and executed on a number of initiatives to ensure that the Company
emerges from the credit cycle stronger.
During the second quarter of 2010, management implemented a comprehensive nonperforming asset
disposition strategy with a goal of more aggressively reducing BB&T’s exposure to nonperforming loans and
foreclosed properties and to reduce or eliminate any delay in exiting the credit cycle. The strategy was
implemented during the second quarter of 2010 as management believed that pricing for distressed assets had
improved. This strategy continued throughout the third and fourth quarters and into 2011. As a result of the
strategy, nonperforming assets, excluding covered foreclosed property, declined from a peak of $4.4 billion at
March 31, 2010, to $4.0 billion as of year-end.
Management also undertook several initiatives during 2010 to strengthen BB&T’s balance sheet. In the
second quarter of 2010, management executed on a deleveraging strategy to better position BB&T’s balance
sheet for a rising rate environment and achieve a better mix of earning assets. In connection with this strategy,
management reduced the balance sheet by approximately $8 billion through the sale of securities. During the
third and fourth quarters of 2010, management executed a strategy to further de-risk the available-for-sale
securities portfolio. The de-risking strategy was aimed at further reducing the duration of the securities portfolio
and reducing the risk of charges to other comprehensive income in a rising rate environment. In addition,
management sold approximately $400 million of non-agency mortgage-backed securities to reduce the potential
for future credit losses. These strategies were the primary driver in generating net securities gains during 2010.
Early in the third quarter, the Dodd-Frank Act was signed into law. This legislation represents one of the
more significant legislative actions to affect the financial services industry. While many of the provisions of the
legislation will have minimal or no financial impact to BB&T, certain aspects are likely to result in higher costs
and reduced revenues in the near term. Over the longer-term, management expects that changes in products and
services offered will minimize or eliminate many of the negative financial impacts to BB&T. For further
discussion of the more significant items included in the Dodd-Frank Act refer to the section titled “Regulatory
Considerations.”
During the fourth quarter of 2010, the Corporation acquired the remaining 30% ownership interest in
Sterling Capital Management, LLC and merged it with its existing investment advisor BB&T Asset
Management, Inc. The merger provides improved operational efficiencies and enhanced client service.
Consolidated net income for 2010 totaled $854 million, a decrease of $23 million, or 2.6%, compared to $877
million earned during 2009. Consolidated net income available to common shareholders for 2010 totaled $816 million,
an increase of $87 million, or 11.9%, compared to $729 million earned during 2009. Net income available to common
shareholders for 2009 included a reduction of $124 million related to the U.S. Treasury’s preferred stock investment
in BB&T. On a diluted per common share basis, earnings for 2010 were $1.16, compared to $1.15 for 2009. BB&T’s
results of operations for 2010 produced a return on average assets of .54% and a return on average common
shareholders’ equity of 4.85% compared to prior year ratios of .56% and 4.93%, respectively.
BB&T generated record revenues totaling $9.4 billion, on a tax-equivalent basis, for 2010, which was up 5.8%
compared to 2009. This was primarily due to growth of 9.9% in fully taxable-equivalent net interest income. The
growth in net interest income was the result of expansion in the net interest margin from 3.66% in 2009 to 4.03%
in 2010. This improvement reflects higher yields on assets acquired in the Colonial acquisition and lower deposit
costs.
17