BB&T 2010 Annual Report Download - page 93
Download and view the complete annual report
Please find page 93 of the 2010 BB&T annual report below. You can navigate through the pages in the report by either clicking on the pages listed below, or by using the keyword search tool below to find specific information within the annual report.-
 1
1 -
2
-
3
-
4
-
5
-
6
-
7
-
8
-
9
-
10
-
11
-
12
-
13
-
14
-
15
-
16
-
17
-
18
-
19
-
20
-
21
-
22
-
23
-
24
-
25
-
26
-
27
-
28
-
29
-
30
-
31
-
32
-
33
-
34
-
35
-
36
-
37
-
38
-
39
-
40
-
41
-
42
-
43
-
44
-
45
-
46
-
47
-
48
-
49
-
50
-
51
-
52
-
53
-
54
-
55
-
56
-
57
-
58
-
59
-
60
-
61
-
62
-
63
-
64
-
65
-
66
-
67
-
68
-
69
-
70
-
71
-
72
-
73
-
74
-
75
-
76
-
77
-
78
-
79
-
80
-
81
-
82
-
 83
83 -
 84
84 -
 85
85 -
 86
86 -
 87
87 -
 88
88 -
 89
89 -
 90
90 -
 91
91 -
 92
92 -
 93
93 -
 94
94 -
 95
95 -
 96
96 -
 97
97 -
 98
98 -
 99
99 -
 100
100 -
 101
101 -
 102
102 -
 103
103 -
104
-
105
-
106
-
107
-
108
-
109
-
110
-
111
-
112
-
113
-
114
-
115
-
116
-
117
-
118
-
119
-
120
-
121
-
122
-
123
-
124
-
125
-
126
-
127
-
128
-
129
-
130
-
131
-
132
-
133
-
134
-
135
-
136
-
137
-
138
-
139
-
140
-
141
-
142
-
143
-
144
-
145
-
146
-
147
-
148
-
149
-
150
-
151
-
152
-
153
-
154
-
155
-
156
-
157
-
158
-
159
-
160
-
161
-
162
-
163
-
164
-
165
-
166
-
167
-
168
-
169
-
170
-
171
-
172
-
173
-
174
-
175
-
176
-
177
-
178
-
179
-
180
-
181
 |
 |
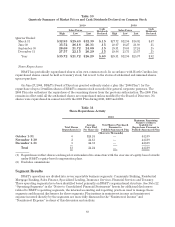
Fourth Quarter Results
Consolidated net income available to common shareholders for the fourth quarter of 2010 of $208 million was
up 12.4% compared to $185 million earned during the same period in 2009. On a diluted per common share basis,
earnings for the fourth quarter of 2010 were $.30, up 11.1% compared to $.27 for the same period in 2009. BB&T’s
results of operations for the fourth quarter of 2010 produced an annualized return on average assets of .54% and
an annualized return on average common shareholders’ equity of 4.88% compared to prior year ratios of .47% and
4.52%, respectively.
Total fully taxable-equivalent revenues were $2.3 billion for the fourth quarter of 2010, up slightly compared
to the fourth quarter of 2009. The increase in total revenues was driven by higher net interest income, as the net
interest margin for the fourth quarter of 2010 improved 24 basis points compared to the fourth quarter of 2009.
The improvement in the net interest margin reflects higher yields on loans acquired in the Colonial acquisition
and lower deposit costs. Interest income on covered and other acquired assets increased $128 million, the
majority of which is offset in the FDIC loss-share income. Net interest income increased at a slower pace due to a
decline in average earning assets of $6.9 billion as a result of the balance sheet deleverage strategy that was
executed in the second quarter of 2010. Noninterest income was down slightly compared to the fourth quarter of
2009, as higher net securities gains of $100 million were offset by a decrease of $43 million in service charges on
deposit accounts and $62 million of losses and writedowns on commercial loans held for sale.
Management completed its strategy to de-risk the investment securities portfolio during the fourth quarter
of 2010. In anticipation of rising rates, management sold approximately $6.1 billion of agency mortgage-backed
securities and replaced them with shorter duration and floating rate securities. In addition, management sold
approximately $400 million of non-agency mortgage-backed securities to reduce the potential for future credit
losses.
The provision for credit losses, excluding covered loans, for the fourth quarter of 2010 declined $182 million,
or 25.1%, compared to the fourth quarter of 2009, as improving credit resulted in lower provision expense. The
provision for covered loans increased $100 million, which was offset by a corresponding $80 million increase in
FDIC loss share income. Net-charge-offs for the fourth quarter of 2010 were $50 million higher than the fourth
quarter of 2009, partially due to $26 million in charge-offs recognized as a result of the continuing NPA
disposition strategy. Overall, the level of nonperforming assets and loan delinquencies were improving and the
outlook for future credit losses is better.
A $15 million provision for income taxes was recorded for the fourth quarter of 2010 compared to $13 million
for the fourth quarter of 2009. This resulted in an effective tax rate for the fourth quarter of 2010 of 6.5%
compared to 6.3% for the prior year’s fourth quarter.
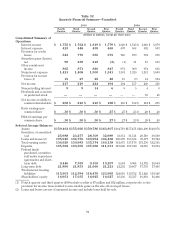
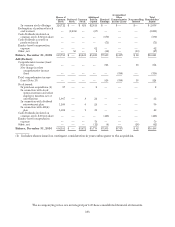
The accompanying table, “Quarterly Financial Summary—Unaudited,” presents condensed information
relating to quarterly periods in the years ended December 31, 2009 and 2008.
93