BB&T 2010 Annual Report Download - page 114
Download and view the complete annual report
Please find page 114 of the 2010 BB&T annual report below. You can navigate through the pages in the report by either clicking on the pages listed below, or by using the keyword search tool below to find specific information within the annual report.-
 1
1 -
2
-
3
-
4
-
5
-
6
-
7
-
8
-
9
-
10
-
11
-
12
-
13
-
14
-
15
-
16
-
17
-
18
-
19
-
20
-
21
-
22
-
23
-
24
-
25
-
26
-
27
-
28
-
29
-
30
-
31
-
32
-
33
-
34
-
35
-
36
-
37
-
38
-
39
-
40
-
41
-
42
-
43
-
44
-
45
-
46
-
47
-
48
-
49
-
50
-
51
-
52
-
53
-
54
-
55
-
56
-
57
-
58
-
59
-
60
-
61
-
62
-
63
-
64
-
65
-
66
-
67
-
68
-
69
-
70
-
71
-
72
-
73
-
74
-
75
-
76
-
77
-
78
-
79
-
80
-
81
-
82
-
83
-
84
-
85
-
86
-
87
-
88
-
89
-
90
-
91
-
92
-
93
-
94
-
95
-
96
-
97
-
98
-
99
-
100
-
101
-
102
-
103
-
 104
104 -
 105
105 -
 106
106 -
 107
107 -
 108
108 -
 109
109 -
 110
110 -
 111
111 -
 112
112 -
 113
113 -
 114
114 -
 115
115 -
 116
116 -
 117
117 -
 118
118 -
 119
119 -
 120
120 -
 121
121 -
 122
122 -
 123
123 -
 124
124 -
125
-
126
-
127
-
128
-
129
-
130
-
131
-
132
-
133
-
134
-
135
-
136
-
137
-
138
-
139
-
140
-
141
-
142
-
143
-
144
-
145
-
146
-
147
-
148
-
149
-
150
-
151
-
152
-
153
-
154
-
155
-
156
-
157
-
158
-
159
-
160
-
161
-
162
-
163
-
164
-
165
-
166
-
167
-
168
-
169
-
170
-
171
-
172
-
173
-
174
-
175
-
176
-
177
-
178
-
179
-
180
-
181
 |
 |

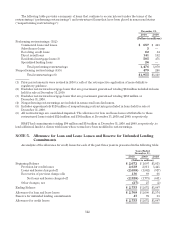
Merger-Related and Restructuring Activities
BB&T has incurred certain merger-related and restructuring expenses. Merger-related and restructuring
expenses or credits include: severance and personnel-related costs or credits, which typically occur in corporate
support and data processing functions; occupancy and equipment charges or credits, which relate to costs or gains
associated with lease terminations, obsolete equipment write-offs, and the sale of duplicate facilities and
equipment; and other merger-related and restructuring charges or credits, which include expenses necessary to
convert and combine the acquired branches and operations of merged companies, direct media advertising related
to the acquisitions, asset and supply inventory write-offs, investment banking advisory fees, and other similar
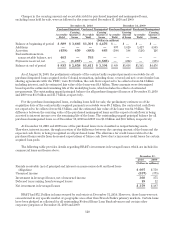
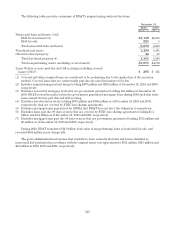
charges. Merger-related and restructuring charges during 2010, 2009 and 2008 were $69 million, $38 million and
$15 million, respectively.
At December 31, 2010 and 2009, there were $10 million and $15 million, respectively, of merger-related and
restructuring accruals. Merger-related and restructuring accruals are established when the costs are incurred or
once all requirements for a plan to dispose of certain business functions have been approved by management. In
general, a major portion of accrued costs are utilized in conjunction with or immediately following the systems
conversion, when most of the duplicate positions are eliminated and the terminated employees begin to receive
severance. Other accruals are utilized over time based on the sale, closing or disposal of duplicate facilities or
equipment or the expiration of lease contracts. Merger and restructuring accruals are re-evaluated periodically
and adjusted as necessary. The remaining accruals at December 31, 2010 are expected to be utilized during 2011,
unless they relate to specific contracts that expire in later years.
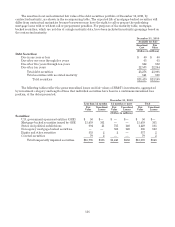
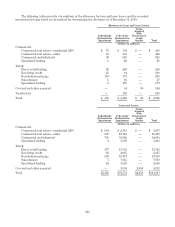
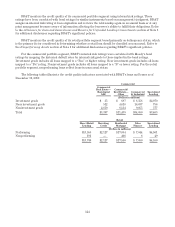
NOTE 3. Securities
The amortized cost and approximate fair values of securities available for sale were as follows:
December 31, 2010
Amortized
Cost
Gross
Unrealized
Fair ValueGains Losses
(Dollars in millions)
Securities available for sale:
U.S. government-sponsored entities (GSE) $ 102 $ 1 $ — $ 103
Mortgage-backed securities issued by GSE 18,663 42 361 18,344
States and political subdivisions 2,051 19 161 1,909
Non-agency mortgage-backed securities 635 — 120 515
Equity and other securities 734 27 2 759
Covered securities 1,234 307 2 1,539
Total securities available for sale $23,419 $396 $646 $23,169
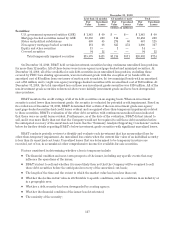
December 31, 2009
Amortized
Cost
Gross
Unrealized
Fair ValueGains Losses
(Dollars in millions)
Securities available for sale:
U.S. government-sponsored entities (GSE) $ 2,090 5 $ 60 $ 2,035
Mortgage-backed securities issued by GSE 26,649 231 210 26,670
States and political subdivisions 2,176 56 125 2,107
Non-agency mortgage-backed securities 1,339 — 317 1,022
Equity and other securities 196 22 — 218
Covered securities 1,166 47 12 1,201
Total securities available for sale $ 33,616 $ 361 $ 724 $ 33,253
114