BB&T 2010 Annual Report Download - page 75
Download and view the complete annual report
Please find page 75 of the 2010 BB&T annual report below. You can navigate through the pages in the report by either clicking on the pages listed below, or by using the keyword search tool below to find specific information within the annual report.-
 1
1 -
2
-
3
-
4
-
5
-
6
-
7
-
8
-
9
-
10
-
11
-
12
-
13
-
14
-
15
-
16
-
17
-
18
-
19
-
20
-
21
-
22
-
23
-
24
-
25
-
26
-
27
-
28
-
29
-
30
-
31
-
32
-
33
-
34
-
35
-
36
-
37
-
38
-
39
-
40
-
41
-
42
-
43
-
44
-
45
-
46
-
47
-
48
-
49
-
50
-
51
-
52
-
53
-
54
-
55
-
56
-
57
-
58
-
59
-
60
-
61
-
62
-
63
-
64
-
 65
65 -
 66
66 -
 67
67 -
 68
68 -
 69
69 -
 70
70 -
 71
71 -
 72
72 -
 73
73 -
 74
74 -
 75
75 -
 76
76 -
 77
77 -
 78
78 -
 79
79 -
 80
80 -
 81
81 -
 82
82 -
 83
83 -
 84
84 -
 85
85 -
86
-
87
-
88
-
89
-
90
-
91
-
92
-
93
-
94
-
95
-
96
-
97
-
98
-
99
-
100
-
101
-
102
-
103
-
104
-
105
-
106
-
107
-
108
-
109
-
110
-
111
-
112
-
113
-
114
-
115
-
116
-
117
-
118
-
119
-
120
-
121
-
122
-
123
-
124
-
125
-
126
-
127
-
128
-
129
-
130
-
131
-
132
-
133
-
134
-
135
-
136
-
137
-
138
-
139
-
140
-
141
-
142
-
143
-
144
-
145
-
146
-
147
-
148
-
149
-
150
-
151
-
152
-
153
-
154
-
155
-
156
-
157
-
158
-
159
-
160
-
161
-
162
-
163
-
164
-
165
-
166
-
167
-
168
-
169
-
170
-
171
-
172
-
173
-
174
-
175
-
176
-
177
-
178
-
179
-
180
-
181
 |
 |
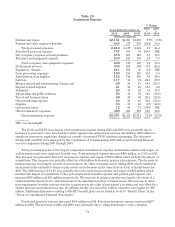
adjustments and sales of foreclosed property. Maintenance cost on foreclosed properties increased by $60 million
and $67 million in 2010 and 2009, respectively, compared to the prior year, while valuation adjustments, including
losses from sales of properties, increased by $331 million and $206 million in 2010 and 2009, respectively. BB&T’s
inventory of foreclosed property decreased by $192 million in 2010 after increasing by $913 million during 2009.
The decline in inventory during 2010 reflects management’s more aggressive efforts to liquidate properties and
improving markets for distressed assets.
Net occupancy and equipment expense increased $29 million, or 5.0%, in 2010. During 2009, net occupancy
and equipment expense increased by $70 million, or 13.8%. The increases in 2010 and 2009 were largely a result of
increased rent expense related to the Colonial acquisition.
Professional services expense increased $72 million, or 27.5%, in 2010. The increase in 2010 included a $30
million increase in legal fees primarily associated with problem loan and other credit related items. In addition,
other professional services increased $42 million during 2010 related to various management initiatives.
Professional services expense increased $58 million during 2009, which included $26 million in higher legal costs
primarily due to credit related items and $32 million for other professional services.
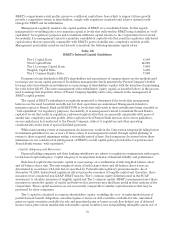
Regulatory charges declined by $19 million in 2010 after an increase of $200 million in 2009. The increase in
2009 was a result of higher FDIC insurance expense, which increased $201 million. The higher FDIC insurance
expense reflects increased premiums charged by the FDIC as one step the FDIC has taken to insure adequate
funding to resolve failed institutions. In addition to the higher premiums, the FDIC also levied a special
assessment of $68 million in the second quarter of 2009. The FDIC also required that insured depository
institutions prepay three years of assessments on December 31, 2009. BB&T’s prepayment was $608 million and
will be expensed as incurred over the three-year period based on the actual FDIC assessment calculation.
Loan processing expenses increased $45 million during 2010 compared to 2009. The 2010 increase includes
additional costs related to the Colonial acquisition and a $23 million increase for losses and reserves related to
future repurchases from BB&T’s investor owned servicing portfolio. BB&T has experienced an increase in
repurchase activity in 2010, with $107 million of loan repurchases and indemnification payments in the current
year compared with $33 million for the full year 2009. While these levels have increased, they remain modest
compared to the industry. During 2009, loan processing expenses increased $10 million, primarily due to the
Colonial acquisition.
Other noninterest expenses increased $122 million, or 14.3%, compared to 2009, which reflected an increase of
$89 million, or 11.7%, compared to 2008. The increase included the impact of $41 million in gains on the
extinguishment of debt that were realized during 2009. In addition, merger-related and restructuring charges and
software expense increased $31 million and $23 million, respectively, from the prior year. The increase in merger-
related charges was primarily due to costs incurred in connection with the Colonial systems conversion. These
increases were partially offset by a decline of $48 million in operational losses compared to the prior year. The
2009 increase was primarily the result of increases in merger-related and restructuring charges and software
expense of $23 million and $20 million, respectively. In addition, the increase for 2009 included $43 million of
additional operational losses compared to 2008. The increases for 2010 and 2009 were impacted by acquisitions
completed during 2009. Please refer to Table 20 for additional detail on fluctuations in other categories of
noninterest expense.
Merger-Related and Restructuring Charges
BB&T recorded certain merger-related and restructuring charges during the years 2010, 2009 and 2008.
These charges are reflected in BB&T’s Consolidated Statements of Income as a category of noninterest expense.
Please Refer to Note 2 “Business Combinations” in the “Notes to Consolidated Financial Statements” for a
summary of mergers and acquisitions consummated during the three years ended December 31, 2010.
During 2010, BB&T recorded $69 million of merger-related and restructuring charges. These amounts were
primarily associated with the acquisition of Colonial and related systems conversions. The 2009 net merger-
related and restructuring charges of $38 million were primarily associated with the acquisition of Colonial. During
2008, BB&T recorded merger-related and restructuring charges of $15 million. These expenses were primarily
associated with the acquisitions of insurance agencies and other merger-related and restructuring activities.
75