BB&T 2010 Annual Report Download - page 95
Download and view the complete annual report
Please find page 95 of the 2010 BB&T annual report below. You can navigate through the pages in the report by either clicking on the pages listed below, or by using the keyword search tool below to find specific information within the annual report.-
 1
1 -
2
-
3
-
4
-
5
-
6
-
7
-
8
-
9
-
10
-
11
-
12
-
13
-
14
-
15
-
16
-
17
-
18
-
19
-
20
-
21
-
22
-
23
-
24
-
25
-
26
-
27
-
28
-
29
-
30
-
31
-
32
-
33
-
34
-
35
-
36
-
37
-
38
-
39
-
40
-
41
-
42
-
43
-
44
-
45
-
46
-
47
-
48
-
49
-
50
-
51
-
52
-
53
-
54
-
55
-
56
-
57
-
58
-
59
-
60
-
61
-
62
-
63
-
64
-
65
-
66
-
67
-
68
-
69
-
70
-
71
-
72
-
73
-
74
-
75
-
76
-
77
-
78
-
79
-
80
-
81
-
82
-
83
-
84
-
 85
85 -
 86
86 -
 87
87 -
 88
88 -
 89
89 -
 90
90 -
 91
91 -
 92
92 -
 93
93 -
 94
94 -
 95
95 -
 96
96 -
 97
97 -
 98
98 -
 99
99 -
 100
100 -
 101
101 -
 102
102 -
 103
103 -
 104
104 -
 105
105 -
106
-
107
-
108
-
109
-
110
-
111
-
112
-
113
-
114
-
115
-
116
-
117
-
118
-
119
-
120
-
121
-
122
-
123
-
124
-
125
-
126
-
127
-
128
-
129
-
130
-
131
-
132
-
133
-
134
-
135
-
136
-
137
-
138
-
139
-
140
-
141
-
142
-
143
-
144
-
145
-
146
-
147
-
148
-
149
-
150
-
151
-
152
-
153
-
154
-
155
-
156
-
157
-
158
-
159
-
160
-
161
-
162
-
163
-
164
-
165
-
166
-
167
-
168
-
169
-
170
-
171
-
172
-
173
-
174
-
175
-
176
-
177
-
178
-
179
-
180
-
181
 |
 |

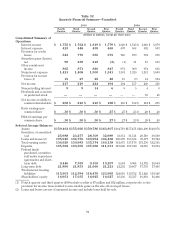
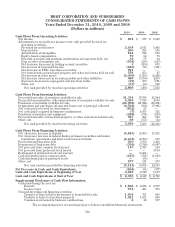
SIX YEAR FINANCIAL SUMMARY AND SELECTED RATIOS (1)
(Dollars in millions, except per share data, shares in thousands)
As of / For the Years Ended December 31, Five Year
Compound
Growth Rate2010 2009 2008 2007 2006 2005
Summary of Operations
Interest income $ 7,115 $ 6,884 $ 7,207 $ 7,894 $ 6,893 $ 5,506 5.3%
Interest expense 1,795 2,040 2,969 4,014 3,185 1,981 (2.0)
Net interest income 5,320 4,844 4,238 3,880 3,708 3,525 8.6
Provision for credit losses 2,638 2,811 1,445 448 240 217 64.8
Net interest income after provision
for credit losses 2,682 2,033 2,793 3,432 3,468 3,308 (4.1)
Noninterest income 3,957 3,934 3,197 2,774 2,521 2,326 11.2
Noninterest expense 5,670 4,931 3,911 3,624 3,511 3,163 12.4
Income before income taxes 969 1,036 2,079 2,582 2,478 2,471 (17.1)
Provision for income taxes 115 159 550 836 945 813 (32.4)
Net income 854 877 1,529 1,746 1,533 1,658 (12.4)
Noncontrolling interest 38 24 10 12 5 4 56.9
Dividends and accretion on preferred
stock —124 21 — — — NM
Net income available to common
shareholders $ 816 $ 729 $ 1,498 $ 1,734 $ 1,528 $ 1,654 (13.2)
Per Common Share
Average shares outstanding:
Basic 692,489 629,583 548,847 547,184 539,140 546,916 4.8
Diluted 701,039 635,619 552,498 551,755 543,891 551,380 4.9
Earnings:
Basic $ 1.18 $ 1.16 $ 2.73 $ 3.17 $ 2.84 $ 3.02 (17.1)
Diluted 1.16 1.15 2.71 3.14 2.81 3.00 (17.3)
Cash dividends declared .60 .92 1.87 1.80 1.64 1.49 (16.6)
Book value 23.67 23.47 23.16 23.14 21.69 20.49 2.9
Average Balances
Securities, at amortized cost $ 27,610 $ 31,226 $ 23,402 $ 21,731 $ 20,110 $ 19,571 7.1
Loans and leases (2) 104,787 102,146 95,195 87,952 79,313 71,517 7.9
Other assets 27,261 21,810 18,284 16,737 14,905 13,524 15.1
Total assets $159,658 $155,182 $136,881 $126,420 $114,328 $104,612 8.8
Deposits $106,773 $102,381 $ 88,831 $ 83,501 $ 77,230 $ 70,346 8.7
Long-term debt 21,653 19,085 19,839 18,045 14,628 11,959 12.6
Other liabilities 14,346 17,478 14,678 12,659 10,939 11,171 5.1
Shareholders’ equity 16,886 16,238 13,533 12,215 11,531 11,136 8.7
Total liabilities and
shareholders’ equity $159,658 $155,182 $136,881 $126,420 $114,328 $104,612 8.8
Period-End Balances
Total assets $157,081 $165,764 $152,015 $132,618 $121,351 $109,170 7.5
Loans and leases (2) 107,264 106,207 98,669 91,686 83,591 75,023 7.4
Deposits 107,213 114,965 98,613 86,766 80,971 74,282 7.6
Long-term debt 21,730 21,376 18,032 18,693 15,904 13,119 10.6
Shareholders’ equity 16,498 16,241 16,081 12,664 11,826 11,201 8.1
Selected Ratios
Rate of return on:
Average total assets .54% .56% 1.12% 1.38% 1.34% 1.58%
Average common equity 4.85 4.93 11.44 14.25 13.35 14.95
Average total equity 5.06 5.40 11.30 14.30 13.30 14.89
Dividend payout 50.85 79.31 68.50 56.78 57.75 49.34
Average equity to average assets 10.58 10.46 9.89 9.66 10.09 10.65
(1) Amounts include the impact of the Colonial acquisition which was completed on August 14, 2009.
(2) Loans and leases are net of unearned income and include loans held for sale.
95