BB&T 2010 Annual Report Download - page 120
Download and view the complete annual report
Please find page 120 of the 2010 BB&T annual report below. You can navigate through the pages in the report by either clicking on the pages listed below, or by using the keyword search tool below to find specific information within the annual report.-
 1
1 -
2
-
3
-
4
-
5
-
6
-
7
-
8
-
9
-
10
-
11
-
12
-
13
-
14
-
15
-
16
-
17
-
18
-
19
-
20
-
21
-
22
-
23
-
24
-
25
-
26
-
27
-
28
-
29
-
30
-
31
-
32
-
33
-
34
-
35
-
36
-
37
-
38
-
39
-
40
-
41
-
42
-
43
-
44
-
45
-
46
-
47
-
48
-
49
-
50
-
51
-
52
-
53
-
54
-
55
-
56
-
57
-
58
-
59
-
60
-
61
-
62
-
63
-
64
-
65
-
66
-
67
-
68
-
69
-
70
-
71
-
72
-
73
-
74
-
75
-
76
-
77
-
78
-
79
-
80
-
81
-
82
-
83
-
84
-
85
-
86
-
87
-
88
-
89
-
90
-
91
-
92
-
93
-
94
-
95
-
96
-
97
-
98
-
99
-
100
-
101
-
102
-
103
-
104
-
105
-
106
-
107
-
108
-
109
-
 110
110 -
 111
111 -
 112
112 -
 113
113 -
 114
114 -
 115
115 -
 116
116 -
 117
117 -
 118
118 -
 119
119 -
 120
120 -
 121
121 -
 122
122 -
 123
123 -
 124
124 -
 125
125 -
 126
126 -
 127
127 -
 128
128 -
 129
129 -
 130
130 -
131
-
132
-
133
-
134
-
135
-
136
-
137
-
138
-
139
-
140
-
141
-
142
-
143
-
144
-
145
-
146
-
147
-
148
-
149
-
150
-
151
-
152
-
153
-
154
-
155
-
156
-
157
-
158
-
159
-
160
-
161
-
162
-
163
-
164
-
165
-
166
-
167
-
168
-
169
-
170
-
171
-
172
-
173
-
174
-
175
-
176
-
177
-
178
-
179
-
180
-
181
 |
 |

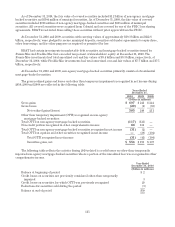
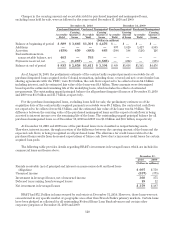
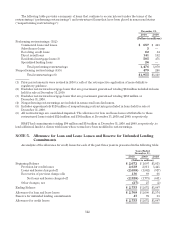
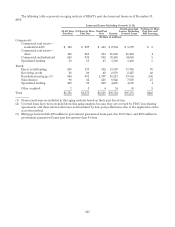
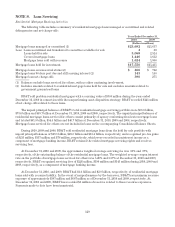
Changes in the carrying amount and accretable yield for purchased impaired and nonimpaired loans,
excluding loans held for sale, were as follows for the years ended December 31, 2010 and 2009:
December 31, 2010 December 31, 2009
Purchased Impaired Purchased Nonimpaired Purchased Impaired Purchased Nonimpaired
Accretable
Yield
Carrying
Amount of
Loans Accretable
Yield
Carrying
Amount of
Loans Accretable
Yield
Carrying
Amount
of Loans Accretable
Yield
Carrying
Amount of
Loans
(Dollars in millions)
Balance at beginning of period $ 889 $ 3,666 $1,301 $ 4,476 $— $— $— $—
Additions ————997 3,820 1,427 4,885
Accretion (459) 459 (483) 483 (108) 108 (126) 126
Reclassifications from
nonaccretable balance, net 405 — 793 — —— — —
Payments received, net — (1,267) — (1,565) — (262) — (535)
Balance at end of period $ 835 $ 2,858 $1,611 $ 3,394 $ 889 $3,666 $1,301 $4,476
As of August 14, 2009, the preliminary estimate of the contractually required payments receivable for all
purchased impaired loans acquired in the Colonial transaction, including those covered and not covered under loss
sharing agreements with the FDIC, were $8.3 billion, the cash flows expected to be collected were $4.8 billion
including interest, and the estimated fair value of the loans was $3.8 billion. These amounts were determined
based upon the estimated remaining life of the underlying loans, which includes the effects of estimated
prepayments. The outstanding unpaid principal balance for all purchased impaired loans as of December 31, 2010
and 2009 was $3.8 billion and $5.7 billion, respectively.
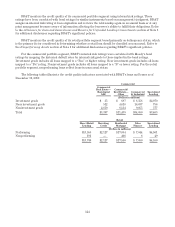
For the purchased nonimpaired loans, excluding loans held for sale, the preliminary estimate as of the
acquisition date of the contractually required payments receivable were $9.1 billion, the contractual cash flows
not expected to be collected were $2.8 billion, and the estimated fair value of the loans was $4.9 billion. The
difference between the carrying value of the purchased nonimpaired loans and the expected cash flows is being
accreted to interest income over the remaining life of the loans. The outstanding unpaid principal balance for all
purchased nonimpaired loans as of December 31, 2010 and 2009 was $5.0 billion and $6.6 billion, respectively.
At December 31, 2010 and 2009 none of the purchased loans were classified as nonperforming assets.
Therefore, interest income, through accretion of the difference between the carrying amount of the loans and the
expected cash flows, is being recognized on all purchased loans. The allowance for credit losses related to the
purchased loans results from decreased expectations of future cash flows due to increased credit losses for certain
acquired loan pools.
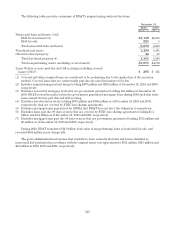
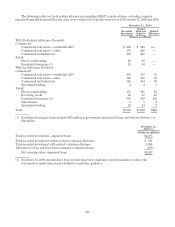
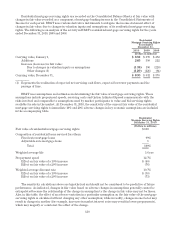
The following table provides details regarding BB&T’s investment in leveraged leases which are included in
commercial loans and leases above:
December 31,
2010 2009
(Dollars in millions)
Rentals receivable (net of principal and interest on nonrecourse debt and head lease
obligation) $ 697 $ 750
Unearned income (337) (375)
Investment in leveraged leases, net of unearned income 360 375
Deferred taxes arising from leveraged leases 19 12
Net investment in leveraged leases $ 379 $ 387
BB&T had $72.1 billion in loans secured by real estate at December 31, 2010. However, these loans were not
concentrated in any specific market or geographic area other than Branch Bank’s primary markets. Certain loans
have been pledged as collateral for all outstanding Federal Home Loan Bank advances and certain other
corporate purposes at December 31, 2010 and 2009.
120