BB&T 2010 Annual Report Download - page 145
Download and view the complete annual report
Please find page 145 of the 2010 BB&T annual report below. You can navigate through the pages in the report by either clicking on the pages listed below, or by using the keyword search tool below to find specific information within the annual report.-
 1
1 -
2
-
3
-
4
-
5
-
6
-
7
-
8
-
9
-
10
-
11
-
12
-
13
-
14
-
15
-
16
-
17
-
18
-
19
-
20
-
21
-
22
-
23
-
24
-
25
-
26
-
27
-
28
-
29
-
30
-
31
-
32
-
33
-
34
-
35
-
36
-
37
-
38
-
39
-
40
-
41
-
42
-
43
-
44
-
45
-
46
-
47
-
48
-
49
-
50
-
51
-
52
-
53
-
54
-
55
-
56
-
57
-
58
-
59
-
60
-
61
-
62
-
63
-
64
-
65
-
66
-
67
-
68
-
69
-
70
-
71
-
72
-
73
-
74
-
75
-
76
-
77
-
78
-
79
-
80
-
81
-
82
-
83
-
84
-
85
-
86
-
87
-
88
-
89
-
90
-
91
-
92
-
93
-
94
-
95
-
96
-
97
-
98
-
99
-
100
-
101
-
102
-
103
-
104
-
105
-
106
-
107
-
108
-
109
-
110
-
111
-
112
-
113
-
114
-
115
-
116
-
117
-
118
-
119
-
120
-
121
-
122
-
123
-
124
-
125
-
126
-
127
-
128
-
129
-
130
-
131
-
132
-
133
-
134
-
 135
135 -
 136
136 -
 137
137 -
 138
138 -
 139
139 -
 140
140 -
 141
141 -
 142
142 -
 143
143 -
 144
144 -
 145
145 -
 146
146 -
 147
147 -
 148
148 -
 149
149 -
 150
150 -
 151
151 -
 152
152 -
 153
153 -
 154
154 -
 155
155 -
156
-
157
-
158
-
159
-
160
-
161
-
162
-
163
-
164
-
165
-
166
-
167
-
168
-
169
-
170
-
171
-
172
-
173
-
174
-
175
-
176
-
177
-
178
-
179
-
180
-
181
 |
 |

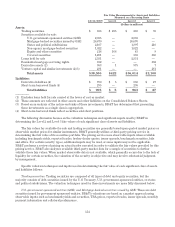
(2) This category includes a common/commingled fund that is comprised of assets from several accounts, pooled
together, to reduce management and administration costs.
(3) The total fair value of plan assets excludes $8 million of accrued income at December 31, 2010.
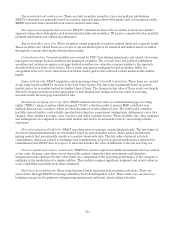
12/31/09
Fair Value Measurements for Plan Assets
Level 1 Level 2 Level 3
(Dollars in millions)
Plan assets:
U.S. equity securities (1) $ 977 $ 977 $— $—
International equity securities (2) 442 332 110 —
Fixed income securities 641 111 530 —
Alternative investments 117 — 25 92
Total plan assets (3) $2,177 $1,420 $665 $ 92
(1) Included in U.S. equity securities is 3.593 million shares of BB&T common stock valued at $92 million at
December 31, 2009.
(2) This category includes a common/commingled fund that is comprised of assets from several accounts, pooled
together, to reduce management and administration costs.
(3) The total fair value of plan assets excludes $7 million of accrued income at December 31, 2009.
The following tables present the activity for Level 3 plan assets for the years ended December 31, 2010 and
2009.
Fair Value Measurements Using
Significant Unobservable Inputs
Alternative
Investments
(Dollars in millions)
Balance at January 1, 2010 $92
Actual return on plan assets 9
Purchases, sales and settlements (1) 23
Balance at December 31, 2010 $124
(1) The net purchases in alternative investments during 2010 relates to investment commitments that existed
prior to January 1, 2009.
Fair Value Measurements Using
Significant Unobservable Inputs
U.S. Equity
Securities (1) Alternative
Investments
(Dollars in millions)
Balance at January 1, 2009 $61 $90
Actual return on plan assets (12) 12
Purchases, sales and settlements — (10)
Transfers in/out out of Level 3 (49) —
Balance at December 31, 2009 $— $ 92
(1) Relates to shares of BB&T common stock that were restricted. These shares were transferred to Level 1
upon the lapse of the restriction.
Postretirement Benefits Other than Pension
BB&T provides certain postretirement benefits. These benefits provide covered employees a subsidy for
purchasing health care and life insurance. In 2004, BB&T changed its postretirement benefit to eliminate the
subsidy for those employees retiring after December 31, 2004. BB&T also reduced the subsidy paid to employees
who retired on or before December 31, 2004, were age 55 years or older, and had at least ten years of service. For
those employees, the subsidy is based upon years of service of the employee at the time of retirement. The effect
of the change in subsidy has been accounted for as a plan amendment and reduced the projected benefit obligation
by $96 million, which is being amortized as a reduction of benefit costs over approximately 17 years. At
145