BB&T 2010 Annual Report Download - page 125
Download and view the complete annual report
Please find page 125 of the 2010 BB&T annual report below. You can navigate through the pages in the report by either clicking on the pages listed below, or by using the keyword search tool below to find specific information within the annual report.-
 1
1 -
2
-
3
-
4
-
5
-
6
-
7
-
8
-
9
-
10
-
11
-
12
-
13
-
14
-
15
-
16
-
17
-
18
-
19
-
20
-
21
-
22
-
23
-
24
-
25
-
26
-
27
-
28
-
29
-
30
-
31
-
32
-
33
-
34
-
35
-
36
-
37
-
38
-
39
-
40
-
41
-
42
-
43
-
44
-
45
-
46
-
47
-
48
-
49
-
50
-
51
-
52
-
53
-
54
-
55
-
56
-
57
-
58
-
59
-
60
-
61
-
62
-
63
-
64
-
65
-
66
-
67
-
68
-
69
-
70
-
71
-
72
-
73
-
74
-
75
-
76
-
77
-
78
-
79
-
80
-
81
-
82
-
83
-
84
-
85
-
86
-
87
-
88
-
89
-
90
-
91
-
92
-
93
-
94
-
95
-
96
-
97
-
98
-
99
-
100
-
101
-
102
-
103
-
104
-
105
-
106
-
107
-
108
-
109
-
110
-
111
-
112
-
113
-
114
-
 115
115 -
 116
116 -
 117
117 -
 118
118 -
 119
119 -
 120
120 -
 121
121 -
 122
122 -
 123
123 -
 124
124 -
 125
125 -
 126
126 -
 127
127 -
 128
128 -
 129
129 -
 130
130 -
 131
131 -
 132
132 -
 133
133 -
 134
134 -
 135
135 -
136
-
137
-
138
-
139
-
140
-
141
-
142
-
143
-
144
-
145
-
146
-
147
-
148
-
149
-
150
-
151
-
152
-
153
-
154
-
155
-
156
-
157
-
158
-
159
-
160
-
161
-
162
-
163
-
164
-
165
-
166
-
167
-
168
-
169
-
170
-
171
-
172
-
173
-
174
-
175
-
176
-
177
-
178
-
179
-
180
-
181
 |
 |

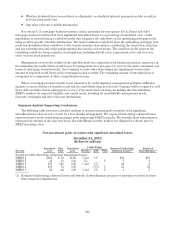
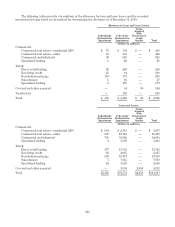
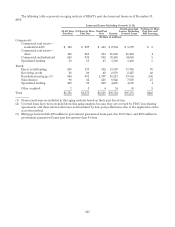
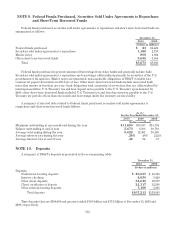
The following table represents an aging analysis of BB&T’s past due loans and leases as of December 31,
2010:
Loans and Leases Excluding Covered (1) (2)
30-89 Days
Past Due 90 Days Or More
Past Due Total Past
Due Current
Total Loans And
Leases, Excluding
Covered Loans
90 Days Or More
Past Due and
Still Accruing
(Dollars in millions)
Commercial:
Commercial real estate—
residential ADC $ 166 $ 297 $ 463 $ 2,934 $ 3,397 $ 8
Commercial real estate—
other 118 265 383 11,056 11,439 4
Commercial and industrial 248 334 582 33,468 34,050 8
Specialized lending 30 13 43 3,360 3,403 5
Retail:
Direct retail lending 209 173 382 13,367 13,749 76
Revolving credit 28 20 48 2,079 2,127 20
Residential mortgage (3) 646 691 1,337 16,213 17,550 296
Sales finance 96 32 128 6,922 7,050 27
Specialized lending 219 50 269 4,281 4,550 1
Other acquired 1 3 4 54 58 3
Total $1,761 $1,878 $3,639 $93,734 $97,373 $448
(1) Nonaccrual loans are included in this aging analysis based on their past due status.
(2) Covered loans have been excluded from this aging analysis because they are covered by FDIC loss sharing
agreements, and their related allowance is determined by loan pool performance due to the application of the
accretion method.
(3) Mortgage loans include $83 million in government guaranteed loans past due 30-89 days, and $153 million in
government guaranteed loans past due greater than 90 days.
125