BB&T 2010 Annual Report Download - page 31
Download and view the complete annual report
Please find page 31 of the 2010 BB&T annual report below. You can navigate through the pages in the report by either clicking on the pages listed below, or by using the keyword search tool below to find specific information within the annual report.-
 1
1 -
2
-
3
-
4
-
5
-
6
-
7
-
8
-
9
-
10
-
11
-
12
-
13
-
14
-
15
-
16
-
17
-
18
-
19
-
20
-
 21
21 -
 22
22 -
 23
23 -
 24
24 -
 25
25 -
 26
26 -
 27
27 -
 28
28 -
 29
29 -
 30
30 -
 31
31 -
 32
32 -
 33
33 -
 34
34 -
 35
35 -
 36
36 -
 37
37 -
 38
38 -
 39
39 -
 40
40 -
 41
41 -
42
-
43
-
44
-
45
-
46
-
47
-
48
-
49
-
50
-
51
-
52
-
53
-
54
-
55
-
56
-
57
-
58
-
59
-
60
-
61
-
62
-
63
-
64
-
65
-
66
-
67
-
68
-
69
-
70
-
71
-
72
-
73
-
74
-
75
-
76
-
77
-
78
-
79
-
80
-
81
-
82
-
83
-
84
-
85
-
86
-
87
-
88
-
89
-
90
-
91
-
92
-
93
-
94
-
95
-
96
-
97
-
98
-
99
-
100
-
101
-
102
-
103
-
104
-
105
-
106
-
107
-
108
-
109
-
110
-
111
-
112
-
113
-
114
-
115
-
116
-
117
-
118
-
119
-
120
-
121
-
122
-
123
-
124
-
125
-
126
-
127
-
128
-
129
-
130
-
131
-
132
-
133
-
134
-
135
-
136
-
137
-
138
-
139
-
140
-
141
-
142
-
143
-
144
-
145
-
146
-
147
-
148
-
149
-
150
-
151
-
152
-
153
-
154
-
155
-
156
-
157
-
158
-
159
-
160
-
161
-
162
-
163
-
164
-
165
-
166
-
167
-
168
-
169
-
170
-
171
-
172
-
173
-
174
-
175
-
176
-
177
-
178
-
179
-
180
-
181
 |
 |
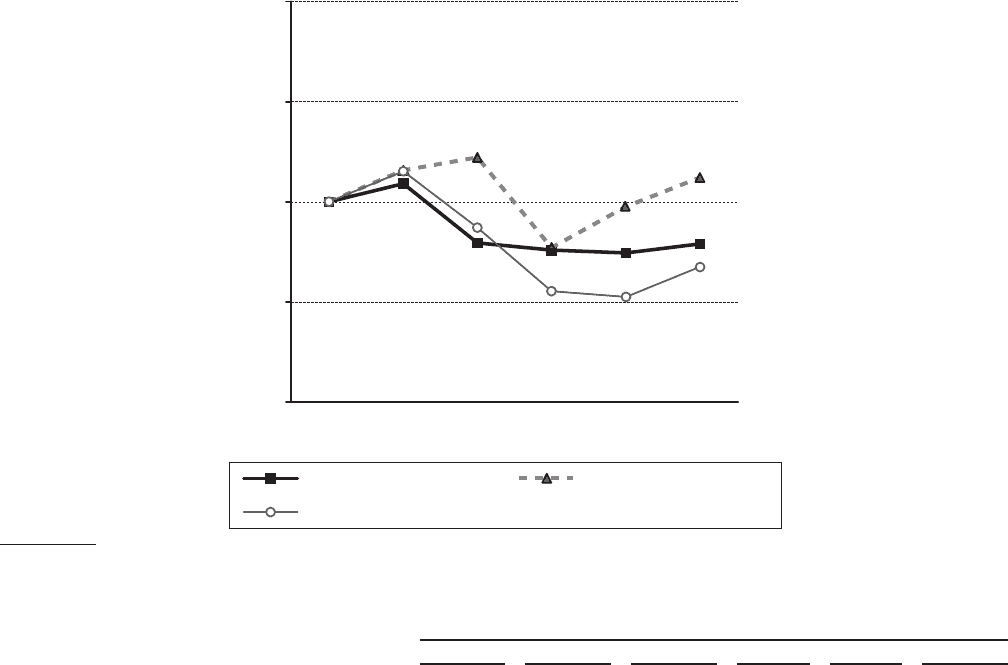
PERFORMANCE GRAPH
Set forth below is a graph comparing the total returns (assuming reinvestment of dividends) of BB&T
Common Stock, the S&P 500 Index, and an Industry Peer Group Index. The graph assumes $100 invested on
December 31, 2005 in BB&T Common Stock and in each of the indices. In 2010, the financial holding companies in
the Industry Peer Group Index (the “Peer Group”) were Capital One Financial Corporation, Comerica
Incorporated, Fifth-Third Bancorp, Huntington Bancshares, Incorporated, KeyCorp, M&T Bank Corporation,
Marshall & Ilsley Corporation, PNC Financial Services Group, Inc., Regions Financial Corporation, SunTrust
Banks, Inc., U.S. Bancorp and Zions Bancorporation. The Peer Group consists of financial and bank holding
companies with assets between approximately $50 billion and $300 billion as of December 31, 2010.
COMPARISON OF 5 YEAR CUMULATIVE TOTAL RETURN*
AMONG BB&T CORPORATION, THE S&P 500 INDEX,
AND BB&T's PEER GROUP
0
50
100
150
200
12/05 12/06 12/07 12/08 12/1012/09
DOLLARS
BB&T CORPORATION S&P 500
BB&T's PEER GROUP
* $100 invested on 12/31/05 in stock or index, including reinvestment of dividends. Fiscal year ending
December 31.
Cumulative Total Return
12/05 12/06 12/07 12/08 12/09 12/10
BB&T CORPORATION $100.00 $108.92 $ 79.37 $75.94 $74.50 $ 78.92
S&P 500 100.00 115.79 122.16 77.10 97.50 112.19
BB&T’s PEER GROUP 100.00 115.24 87.07 55.37 52.56 67.50
31