BB&T 2010 Annual Report Download - page 48
Download and view the complete annual report
Please find page 48 of the 2010 BB&T annual report below. You can navigate through the pages in the report by either clicking on the pages listed below, or by using the keyword search tool below to find specific information within the annual report.-
 1
1 -
2
-
3
-
4
-
5
-
6
-
7
-
8
-
9
-
10
-
11
-
12
-
13
-
14
-
15
-
16
-
17
-
18
-
19
-
20
-
21
-
22
-
23
-
24
-
25
-
26
-
27
-
28
-
29
-
30
-
31
-
32
-
33
-
34
-
35
-
36
-
37
-
 38
38 -
 39
39 -
 40
40 -
 41
41 -
 42
42 -
 43
43 -
 44
44 -
 45
45 -
 46
46 -
 47
47 -
 48
48 -
 49
49 -
 50
50 -
 51
51 -
 52
52 -
 53
53 -
 54
54 -
 55
55 -
 56
56 -
 57
57 -
 58
58 -
59
-
60
-
61
-
62
-
63
-
64
-
65
-
66
-
67
-
68
-
69
-
70
-
71
-
72
-
73
-
74
-
75
-
76
-
77
-
78
-
79
-
80
-
81
-
82
-
83
-
84
-
85
-
86
-
87
-
88
-
89
-
90
-
91
-
92
-
93
-
94
-
95
-
96
-
97
-
98
-
99
-
100
-
101
-
102
-
103
-
104
-
105
-
106
-
107
-
108
-
109
-
110
-
111
-
112
-
113
-
114
-
115
-
116
-
117
-
118
-
119
-
120
-
121
-
122
-
123
-
124
-
125
-
126
-
127
-
128
-
129
-
130
-
131
-
132
-
133
-
134
-
135
-
136
-
137
-
138
-
139
-
140
-
141
-
142
-
143
-
144
-
145
-
146
-
147
-
148
-
149
-
150
-
151
-
152
-
153
-
154
-
155
-
156
-
157
-
158
-
159
-
160
-
161
-
162
-
163
-
164
-
165
-
166
-
167
-
168
-
169
-
170
-
171
-
172
-
173
-
174
-
175
-
176
-
177
-
178
-
179
-
180
-
181
 |
 |

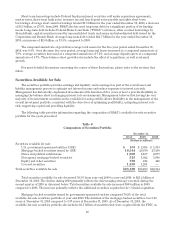
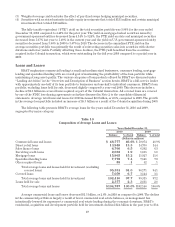
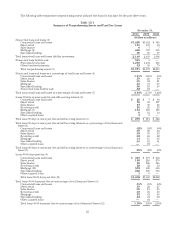
The following table presents BB&T’s securities portfolio at December 31, 2010, segregated by major
category with ranges of maturities and average yields disclosed.
Table 9
Securities
December 31, 2010
Fair Value Weighted
Average Yield (1)
(Dollars in millions)
U.S. government-sponsored entities (GSE):
Within one year $ 50 0.06%
One to five years 50 4.36
Five to ten years 1 2.70
After ten years 2 4.08
Total 103 2.22
Mortgage-backed securities issued by GSE (2):
One to five years 4 6.74
Five to ten years 331 3.18
After ten years 18,009 1.84
Total 18,344 1.86
Obligations of states and political subdivisions (3):
Within one year 10 6.97
One to five years 5 7.32
Five to ten years 94 6.90
After ten years 1,787 6.57
Total 1,896 6.59
Non-agency mortgage-backed securities (2):
One to five years 1 3.71
Five to ten years 2 5.93
After ten years 512 5.90
Total 515 5.90
Other securities:
One to five years 5 5.33
Five to ten years 8 6.49
After ten years 591 1.31
Total 604 1.41
Covered securities (2):
Five to ten years 196 5.48
After ten years 1,343 13.21
Total 1,539 11.99
Securities with no stated maturity (4) 168 2.16
Total available-for-sale securities $23,169 2.89%
(1) Yields on tax-exempt securities are calculated on a taxable-equivalent basis using the statutory federal
income tax rate of 35%. Yields for available-for-sale securities are calculated based on the amortized cost of
the securities.
(2) For purposes of the maturity table, mortgage-backed securities, which are not due at a single maturity date,
have been included in maturity groupings based on the contractual maturity. The expected life of mortgage-
backed securities will differ from contractual maturities because borrowers may have the right to call or
prepay the underlying mortgage loans with or without call or prepayment penalties.
48