BB&T 2010 Annual Report Download - page 71
Download and view the complete annual report
Please find page 71 of the 2010 BB&T annual report below. You can navigate through the pages in the report by either clicking on the pages listed below, or by using the keyword search tool below to find specific information within the annual report.-
 1
1 -
2
-
3
-
4
-
5
-
6
-
7
-
8
-
9
-
10
-
11
-
12
-
13
-
14
-
15
-
16
-
17
-
18
-
19
-
20
-
21
-
22
-
23
-
24
-
25
-
26
-
27
-
28
-
29
-
30
-
31
-
32
-
33
-
34
-
35
-
36
-
37
-
38
-
39
-
40
-
41
-
42
-
43
-
44
-
45
-
46
-
47
-
48
-
49
-
50
-
51
-
52
-
53
-
54
-
55
-
56
-
57
-
58
-
59
-
60
-
 61
61 -
 62
62 -
 63
63 -
 64
64 -
 65
65 -
 66
66 -
 67
67 -
 68
68 -
 69
69 -
 70
70 -
 71
71 -
 72
72 -
 73
73 -
 74
74 -
 75
75 -
 76
76 -
 77
77 -
 78
78 -
 79
79 -
 80
80 -
 81
81 -
82
-
83
-
84
-
85
-
86
-
87
-
88
-
89
-
90
-
91
-
92
-
93
-
94
-
95
-
96
-
97
-
98
-
99
-
100
-
101
-
102
-
103
-
104
-
105
-
106
-
107
-
108
-
109
-
110
-
111
-
112
-
113
-
114
-
115
-
116
-
117
-
118
-
119
-
120
-
121
-
122
-
123
-
124
-
125
-
126
-
127
-
128
-
129
-
130
-
131
-
132
-
133
-
134
-
135
-
136
-
137
-
138
-
139
-
140
-
141
-
142
-
143
-
144
-
145
-
146
-
147
-
148
-
149
-
150
-
151
-
152
-
153
-
154
-
155
-
156
-
157
-
158
-
159
-
160
-
161
-
162
-
163
-
164
-
165
-
166
-
167
-
168
-
169
-
170
-
171
-
172
-
173
-
174
-
175
-
176
-
177
-
178
-
179
-
180
-
181
 |
 |

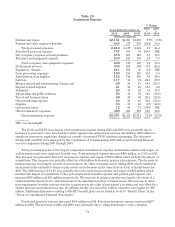
Mortgage banking income totaled $521 million, $658 million and $275 million during 2010, 2009 and 2008,
respectively. The following table provides a breakdown of the various components of mortgage banking income
and related statistical information:
Table 19
Mortgage Banking Income and Related Statistical Information
As of / For the Years
Ended December 31,
% Change
2010
v.
2009
2009
v.
2008Mortgage Banking Income 2010 2009 2008
(Dollars in millions)
Residential Mortgage Banking:
Residential mortgage production income $ 301 $ 457 $ 127 (34.1)% 259.8%
Residential Mortgage Servicing:
Residential mortgage servicing fees 226 190 145 18.9 31.0
Residential mortgage servicing rights (decrease) increase in
fair value due to change in valuation inputs or
assumptions (1) (139) 190 (220)
Mortgage servicing rights hedging gains (losses) 196 (98) 262
Net 57 92 42 (38.0) 119.0
Realization of expected residential mortgage servicing rights
cash flows (129) (126) (94) 2.4 34.0
Total residential mortgage servicing income 154 156 93 (1.3) 67.7
Total residential mortgage banking income 455 613 220 (25.8) 178.6
Commercial Mortgage Banking:
Commercial mortgage banking revenues 84 63 69 33.3 (8.7)
Amortization of commercial mortgage servicing rights (18) (18) (14) — 28.6
Total commercial mortgage banking income 66 45 55 46.7 (18.2)
Total mortgage banking income $ 521 $ 658 $ 275 (20.8) 139.3
As of / For the Years
Ended December 31,
% Change
2010
v.
2009
2009
v.
2008Mortgage Banking Statistical Information 2010 2009 2008
(Dollars in millions)
Residential mortgage originations $24,866 $28,183 $16,438 (11.8)% 71.5%
Residential mortgage loans serviced for others 61,791 54,523 40,677 13.3 34.0
Residential mortgage loan sales 19,100 25,773 13,405 (25.9) 92.3
Commercial mortgage originations 3,085 2,342 3,717 31.7 (37.0)
Commercial mortgage loans serviced for others 24,057 24,253 23,902 (.8) 1.5
(1) Includes a $1 million decrease due to a valuation adjustment for MSRs carried at the lower of cost or market
during the twelve months ended December 31, 2010.
Mortgage banking income decreased $137 million, or 20.8%, during 2010, following a record year in 2009.
Residential mortgage production income declined $156 million compared with 2009 due to lower gains on sales in
the current year, as originations declined and the proportion of loans sold decreased due to a decision in the third
quarter of 2010 to retain a portion of 10 to 15 year fixed- and adjustable-rate mortgage production. Residential
mortgage servicing income was relatively flat in 2010 compared to 2009, as growth in servicing fees of $36 million
from an increase in the size of the loan servicing portfolio was offset by a $35 million unfavorable net change in
the valuation for mortgage servicing rights and related economic hedging activities. Commercial mortgage
banking income was up $21 million, or 46.7%, in 2010 due to improved market conditions. Mortgage banking
income increased $383 million, or 139.3%, during 2009. This increase includes the net change in the mortgage
servicing rights valuation, which resulted in an increase of $50 million compared to 2008. Mortgage banking
income for 2008 included certain one-time items associated with the implementation of fair value accounting
71