BB&T 2010 Annual Report Download - page 144
Download and view the complete annual report
Please find page 144 of the 2010 BB&T annual report below. You can navigate through the pages in the report by either clicking on the pages listed below, or by using the keyword search tool below to find specific information within the annual report.-
 1
1 -
2
-
3
-
4
-
5
-
6
-
7
-
8
-
9
-
10
-
11
-
12
-
13
-
14
-
15
-
16
-
17
-
18
-
19
-
20
-
21
-
22
-
23
-
24
-
25
-
26
-
27
-
28
-
29
-
30
-
31
-
32
-
33
-
34
-
35
-
36
-
37
-
38
-
39
-
40
-
41
-
42
-
43
-
44
-
45
-
46
-
47
-
48
-
49
-
50
-
51
-
52
-
53
-
54
-
55
-
56
-
57
-
58
-
59
-
60
-
61
-
62
-
63
-
64
-
65
-
66
-
67
-
68
-
69
-
70
-
71
-
72
-
73
-
74
-
75
-
76
-
77
-
78
-
79
-
80
-
81
-
82
-
83
-
84
-
85
-
86
-
87
-
88
-
89
-
90
-
91
-
92
-
93
-
94
-
95
-
96
-
97
-
98
-
99
-
100
-
101
-
102
-
103
-
104
-
105
-
106
-
107
-
108
-
109
-
110
-
111
-
112
-
113
-
114
-
115
-
116
-
117
-
118
-
119
-
120
-
121
-
122
-
123
-
124
-
125
-
126
-
127
-
128
-
129
-
130
-
131
-
132
-
133
-
 134
134 -
 135
135 -
 136
136 -
 137
137 -
 138
138 -
 139
139 -
 140
140 -
 141
141 -
 142
142 -
 143
143 -
 144
144 -
 145
145 -
 146
146 -
 147
147 -
 148
148 -
 149
149 -
 150
150 -
 151
151 -
 152
152 -
 153
153 -
 154
154 -
155
-
156
-
157
-
158
-
159
-
160
-
161
-
162
-
163
-
164
-
165
-
166
-
167
-
168
-
169
-
170
-
171
-
172
-
173
-
174
-
175
-
176
-
177
-
178
-
179
-
180
-
181
 |
 |

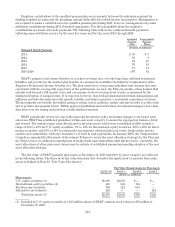
Employer contributions to the qualified pension plan are in amounts between the minimum required for
funding standard accounts and the maximum amount deductible for federal income tax purposes. Management is
not required to make a contribution to the qualified pension plan during 2011; however, management may make
additional contributions during 2011 if deemed appropriate. For the nonqualified plans the employer
contributions are based on benefit payments. The following table reflects the estimated benefit payments
reflecting expected future service for the next five years and for the years 2016 through 2020.
Qualified
Pension
Plan
Nonqualified
Pension
Plans
(Dollars in millions)
Estimated Benefit Payments
2011 $53 $9
2012 59 9
2013 64 10
2014 70 10
2015 77 11
2016-2020 507 61
BB&T’s primary total return objective is to achieve returns that, over the long term, will fund retirement
liabilities and provide for the desired plan benefits in a manner that satisfies the fiduciary requirements of the
Employee Retirement Income Security Act. The plan assets have a long-term, indefinite time horizon that runs
concurrent with the average life expectancy of the participants. As such, the Plan can assume a time horizon that
extends well beyond a full market cycle, and can assume an above-average level of risk, as measured by the
standard deviation of annual return. It is expected, however, that both professional investment management and
sufficient portfolio diversification will smooth volatility and help to generate a reasonable consistency of return.
The investments are broadly diversified among economic sector, industry, quality and size in order to reduce risk
and to produce incremental return. Within approved guidelines and restrictions, investment managers have wide
discretion over the timing and selection of individual investments.
BB&T periodically reviews its asset allocation and investment policy and makes changes to its target asset
allocation. BB&T has established guidelines within each asset category to ensure the appropriate balance of risk
and reward. The current target asset allocations for the plan assets, which were established in 2006, include a
range of 35% to 45% for U.S. equity securities, 7% to 13% for international equity securities, 20% to 30% for fixed
income securities, and 10% to 30% for alternative investments, which include real estate, hedge funds, private
equities and commodities, with any remainder to be held in cash equivalents. In January 2009, the Compensation
Committee amended the Statement of Investment Policies to revise the asset allocation strategy for the Plan and
the Trust to have no additional commitments in hedge funds and commodities until further notice. Currently, the
asset allocations of other plan asset classes may be outside of established parameters pending adoption of the new
asset allocation strategy.
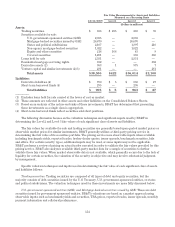
The fair value of BB&T’s pension plan assets at December 31, 2010 and 2009, by asset category are reflected
in the following tables. The three level fair value hierarchy that describes the inputs used to measure these plan
assets is defined in Note 19 “Fair Value Disclosures”.
12/31/10
Fair Value Measurements for Plan Assets
Level 1 Level 2 Level 3
(Dollars in millions)
Plan assets:
U.S. equity securities (1) $1,098 $1,098 $— $—
International equity securities (2) 488 384 104 —
Fixed income securities 766 121 645 —
Alternative investments 124 — — 124
Total plan assets (3) $2,476 $1,603 $749 $124
(1) Included in U.S. equity securities is 3.615 million shares of BB&T common stock valued at $95 million at
December 31, 2010.
144