BB&T 2010 Annual Report Download - page 99
Download and view the complete annual report
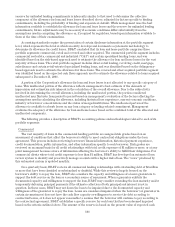
Please find page 99 of the 2010 BB&T annual report below. You can navigate through the pages in the report by either clicking on the pages listed below, or by using the keyword search tool below to find specific information within the annual report.-
 1
1 -
2
-
3
-
4
-
5
-
6
-
7
-
8
-
9
-
10
-
11
-
12
-
13
-
14
-
15
-
16
-
17
-
18
-
19
-
20
-
21
-
22
-
23
-
24
-
25
-
26
-
27
-
28
-
29
-
30
-
31
-
32
-
33
-
34
-
35
-
36
-
37
-
38
-
39
-
40
-
41
-
42
-
43
-
44
-
45
-
46
-
47
-
48
-
49
-
50
-
51
-
52
-
53
-
54
-
55
-
56
-
57
-
58
-
59
-
60
-
61
-
62
-
63
-
64
-
65
-
66
-
67
-
68
-
69
-
70
-
71
-
72
-
73
-
74
-
75
-
76
-
77
-
78
-
79
-
80
-
81
-
82
-
83
-
84
-
85
-
86
-
87
-
88
-
 89
89 -
 90
90 -
 91
91 -
 92
92 -
 93
93 -
 94
94 -
 95
95 -
 96
96 -
 97
97 -
 98
98 -
 99
99 -
 100
100 -
 101
101 -
 102
102 -
 103
103 -
 104
104 -
 105
105 -
 106
106 -
 107
107 -
 108
108 -
 109
109 -
110
-
111
-
112
-
113
-
114
-
115
-
116
-
117
-
118
-
119
-
120
-
121
-
122
-
123
-
124
-
125
-
126
-
127
-
128
-
129
-
130
-
131
-
132
-
133
-
134
-
135
-
136
-
137
-
138
-
139
-
140
-
141
-
142
-
143
-
144
-
145
-
146
-
147
-
148
-
149
-
150
-
151
-
152
-
153
-
154
-
155
-
156
-
157
-
158
-
159
-
160
-
161
-
162
-
163
-
164
-
165
-
166
-
167
-
168
-
169
-
170
-
171
-
172
-
173
-
174
-
175
-
176
-
177
-
178
-
179
-
180
-
181
 |
 |

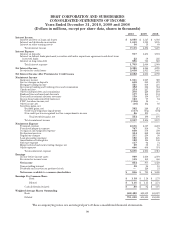
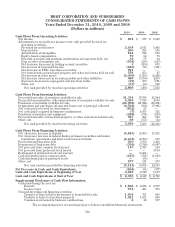
BB&T CORPORATION AND SUBSIDIARIES
CONSOLIDATED STATEMENTS OF INCOME
Years Ended December 31, 2010, 2009 and 2008
(Dollars in millions, except per share data, shares in thousands)
2010 2009 2008
Interest Income
Interest and fees on loans and leases $ 6,080 $ 5,547 $ 6,003
Interest and dividends on securities 1,019 1,319 1,135
Interest on other earning assets 16 18 69
Total interest income 7,115 6,884 7,207
Interest Expense
Interest on deposits 917 1,271 1,891
Interest on federal funds purchased, securities sold under repurchase agreements and short-term
borrowed funds 22 58 235
Interest on long-term debt 856 711 843
Total interest expense 1,795 2,040 2,969
Net Interest Income 5,320 4,844 4,238
Provision for credit losses 2,638 2,811 1,445
Net Interest Income After Provision for Credit Losses 2,682 2,033 2,793
Noninterest Income
Insurance income 1,041 1,047 928
Service charges on deposits 618 690 673
Mortgage banking income 521 658 275
Investment banking and brokerage fees and commissions 352 346 354
Checkcard fees 274 227 201
Other nondeposit fees and commissions 270 229 189
Bankcard fees and merchant discounts 177 156 151
Trust and investment advisory revenues 159 139 147
Income from bank-owned life insurance 123 97 84
FDIC loss share income, net (116) 14 —
Other income, net (16) 132 88
Securities gains, net
Realized gains, net 585 240 211
Other-than-temporary impairments (117) (172) (104)
Non-credit portion recognized in other comprehensive income 86 131 —
Total securities gains, net 554 199 107
Total noninterest income 3,957 3,934 3,197
Noninterest Expense
Personnel expense 2,616 2,517 2,201
Foreclosed property expense 747 356 79
Occupancy and equipment expense 608 579 509
Professional services 334 262 204
Regulatory charges 211 230 30
Loan processing expenses 180 135 125
Amortization of intangibles 122 114 100
Software expense 117 94 74
Merger-related and restructuring charges, net 69 38 15
Other expenses 666 606 574
Total noninterest expense 5,670 4,931 3,911
Earnings
Income before income taxes 969 1,036 2,079
Provision for income taxes 115 159 550
Net income 854 877 1,529
Noncontrolling interest 38 24 10
Dividends and accretion on preferred stock —124 21
Net income available to common shareholders $ 816 $ 729 $ 1,498
Earnings Per Common Share
Basic $ 1.18 $ 1.16 $ 2.73
Diluted $ 1.16 $ 1.15 $ 2.71
Cash dividends declared $ .60 $ .92 $ 1.87
Weighted Average Shares Outstanding
Basic 692,489 629,583 548,847
Diluted 701,039 635,619 552,498
The accompanying notes are an integral part of these consolidated financial statements.
99