BB&T 2010 Annual Report Download - page 89
Download and view the complete annual report
Please find page 89 of the 2010 BB&T annual report below. You can navigate through the pages in the report by either clicking on the pages listed below, or by using the keyword search tool below to find specific information within the annual report.-
 1
1 -
2
-
3
-
4
-
5
-
6
-
7
-
8
-
9
-
10
-
11
-
12
-
13
-
14
-
15
-
16
-
17
-
18
-
19
-
20
-
21
-
22
-
23
-
24
-
25
-
26
-
27
-
28
-
29
-
30
-
31
-
32
-
33
-
34
-
35
-
36
-
37
-
38
-
39
-
40
-
41
-
42
-
43
-
44
-
45
-
46
-
47
-
48
-
49
-
50
-
51
-
52
-
53
-
54
-
55
-
56
-
57
-
58
-
59
-
60
-
61
-
62
-
63
-
64
-
65
-
66
-
67
-
68
-
69
-
70
-
71
-
72
-
73
-
74
-
75
-
76
-
77
-
78
-
 79
79 -
 80
80 -
 81
81 -
 82
82 -
 83
83 -
 84
84 -
 85
85 -
 86
86 -
 87
87 -
 88
88 -
 89
89 -
 90
90 -
 91
91 -
 92
92 -
 93
93 -
 94
94 -
 95
95 -
 96
96 -
 97
97 -
 98
98 -
 99
99 -
100
-
101
-
102
-
103
-
104
-
105
-
106
-
107
-
108
-
109
-
110
-
111
-
112
-
113
-
114
-
115
-
116
-
117
-
118
-
119
-
120
-
121
-
122
-
123
-
124
-
125
-
126
-
127
-
128
-
129
-
130
-
131
-
132
-
133
-
134
-
135
-
136
-
137
-
138
-
139
-
140
-
141
-
142
-
143
-
144
-
145
-
146
-
147
-
148
-
149
-
150
-
151
-
152
-
153
-
154
-
155
-
156
-
157
-
158
-
159
-
160
-
161
-
162
-
163
-
164
-
165
-
166
-
167
-
168
-
169
-
170
-
171
-
172
-
173
-
174
-
175
-
176
-
177
-
178
-
179
-
180
-
181
 |
 |
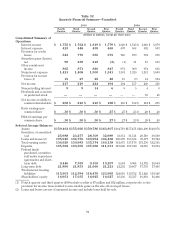
Community Banking
The Community Banking network had 1,782 banking offices at the end of 2010, a decrease of 75 offices
compared to 1,857 banking offices at December 31, 2009. The decrease in offices resulted primarily from the
closing of overlapping banking offices related to the acquisition of Colonial.
Community Banking had solid organic deposit growth during 2010, while the loan portfolios declined slightly
due to weak economic conditions and the lack of strong demand for lending products. Net income attributable to
Community Banking decreased $211 million, or 47.1%, to $237 million compared to 2009, primarily as a result of
foreclosed property expenses, as well as problem loan administration expense. Comparing 2009 to 2008, net
income in Community Banking decreased $604 million, or 57.4% to $448 million.
Net interest income for Community Banking totaled $3.8 billion in 2010 compared to $3.6 billion in 2009.
Growth in net interest income was primarily due to an increase of $137 million in net interest income from clients
and an increase of $72 million in net funds transfer pricing (“FTP”) provided to Community Banking during 2010.
The increase in net interest income from clients in 2010 was primarily due to improvements in the deposit mix
specifically related to a decrease in client certificates of deposits. The increase in net interest income as a result of
the improvement in deposit mix was partially offset by the impact of historically low interest rates, as well as
elevated nonaccrual balances, on interest income from loans. Net interest income earned for 2009 rose by $394
million, or 12.2%, compared to 2008. The increase in the net interest income was primarily due to higher FTP
provided to Community Banking during 2009.
The economic provision for loan and lease losses declined by $82 million, or 4.4%, to $1.8 billion in 2010
compared to 2009, reflecting improvement in the outlook on credit quality. The economic provision for loan and
lease losses increased $1.0 billion, or 123.1%, from 2008 to 2009. The increase during 2009 reflected deterioration
in the residential acquisition and development portfolio.
Noninterest income in Community Banking decreased $25 million, or 2.0%, to $1.3 billion in 2010, primarily
due to lower overdraft fees, along with losses on commercial loans held for sale, partially offset by increases in
checkcard fees, bankcard fees and merchant discounts and account analysis fees. In 2009, noninterest income
increased $41 million, or 3.3%, driven primarily by the Colonial acquisition, which contributed $44 million in
noninterest income to Community Banking. Noninterest income allocated from other segments, which is reflected
as intersegment net referral fees (“referral fees”), declined by $53 million, or 11.5% in 2010, primarily due to
lower referrals for residential mortgage lending as originations slowed. Noninterest income allocated from other
segments of $461 million in 2009 was $207 million, or 81.5% higher than 2008, driven primarily by higher referrals
for mortgage lending.
Noninterest expenses incurred by Community Banking during 2010 increased $427 million, or 20.5%, to $2.5
billion compared to 2009. The increase was primarily due to foreclosed property expenses and problem loan
administration expense, along with increases in compensation, fringe benefit, and FDIC insurance costs.
Comparing 2009 to 2008, noninterest expenses increased $535 million, or 34.7%. The acquisition of the Colonial
branches created $160 million of additional noninterest expense in 2009 for Community Banking. The remaining
increase of $375 million was primarily due to the increase in foreclosed property expenses and FDIC insurance
premiums. Allocated corporate expenses increased $128 million, or 18.3%, to $827 million in 2010, primarily due to
increases in loan administration expense, IT services and operations. Comparing 2009 to 2008, allocated corporate
expenses declined by $1 million, or 0.1%.
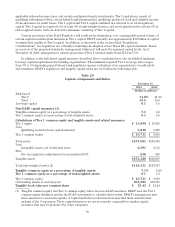
Total identifiable assets for Community Banking decreased $2.4 billion in 2010, or 3.9%, to $60.4 billion,
compared to a decrease of $2.0 billion, or 3.1%, in 2009. The loan portfolios declined due to the sale of specific
nonperforming commercial loans, the general economic conditions, and lack of strong demand for lending products
during 2010.
Residential Mortgage Banking
BB&T’s mortgage originations totaled $24.9 billion in 2010, down 11.7% from a record $28.2 billion in 2009.
BB&T’s residential mortgage servicing portfolio, which includes portfolio loans on BB&T’s balance sheet and
89