BB&T 2010 Annual Report Download - page 129
Download and view the complete annual report
Please find page 129 of the 2010 BB&T annual report below. You can navigate through the pages in the report by either clicking on the pages listed below, or by using the keyword search tool below to find specific information within the annual report.-
 1
1 -
2
-
3
-
4
-
5
-
6
-
7
-
8
-
9
-
10
-
11
-
12
-
13
-
14
-
15
-
16
-
17
-
18
-
19
-
20
-
21
-
22
-
23
-
24
-
25
-
26
-
27
-
28
-
29
-
30
-
31
-
32
-
33
-
34
-
35
-
36
-
37
-
38
-
39
-
40
-
41
-
42
-
43
-
44
-
45
-
46
-
47
-
48
-
49
-
50
-
51
-
52
-
53
-
54
-
55
-
56
-
57
-
58
-
59
-
60
-
61
-
62
-
63
-
64
-
65
-
66
-
67
-
68
-
69
-
70
-
71
-
72
-
73
-
74
-
75
-
76
-
77
-
78
-
79
-
80
-
81
-
82
-
83
-
84
-
85
-
86
-
87
-
88
-
89
-
90
-
91
-
92
-
93
-
94
-
95
-
96
-
97
-
98
-
99
-
100
-
101
-
102
-
103
-
104
-
105
-
106
-
107
-
108
-
109
-
110
-
111
-
112
-
113
-
114
-
115
-
116
-
117
-
118
-
 119
119 -
 120
120 -
 121
121 -
 122
122 -
 123
123 -
 124
124 -
 125
125 -
 126
126 -
 127
127 -
 128
128 -
 129
129 -
 130
130 -
 131
131 -
 132
132 -
 133
133 -
 134
134 -
 135
135 -
 136
136 -
 137
137 -
 138
138 -
 139
139 -
140
-
141
-
142
-
143
-
144
-
145
-
146
-
147
-
148
-
149
-
150
-
151
-
152
-
153
-
154
-
155
-
156
-
157
-
158
-
159
-
160
-
161
-
162
-
163
-
164
-
165
-
166
-
167
-
168
-
169
-
170
-
171
-
172
-
173
-
174
-
175
-
176
-
177
-
178
-
179
-
180
-
181
 |
 |

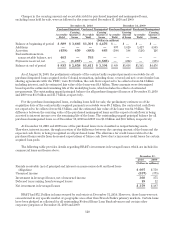
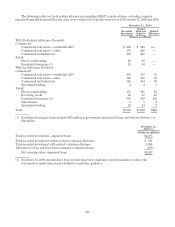
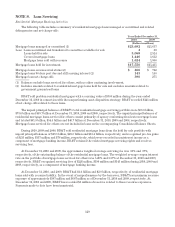
NOTE 8. Loan Servicing
Residential Mortgage Banking Activities
The following table includes a summary of residential mortgage loans managed or securitized and related
delinquencies and net charge-offs:
Years Ended December 31,
2010 2009
(Dollars in millions)
Mortgage loans managed or securitized (1) $23,692 $21,637
Less: Loans securitized and transferred to securities available for sale 460
Loans held for sale 3,068 2,524
Covered mortgage loans 1,446 1,632
Mortgage loans sold with recourse 1,624 1,986
Mortgage loans held for investment $17,550 $15,435
Mortgage loans on nonaccrual status (2) $ 466 $ 712
Mortgage loans 90 days past due and still accruing interest (2) 143 150
Mortgage loan net charge-offs 390 275
(1) Balances exclude loans serviced for others, with no other continuing involvement.
(2) Includes amounts related to residential mortgage loans held for sale and excludes amounts related to
government guaranteed loans
BB&T sold problem residential mortgages with a carrying value of $388 million during the year ended
December 31, 2010 in connection with the nonperforming asset disposition strategy. BB&T recorded $141 million
of net charge-offs related to these loans.
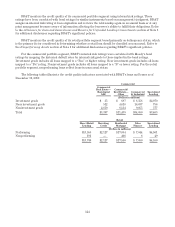
The unpaid principal balances of BB&T’s total residential mortgage servicing portfolio were $83.6 billion,
$73.6 billion and $59.7 billion at December 31, 2010, 2009 and 2008, respectively. The unpaid principal balances of
residential mortgage loans serviced for others consist primarily of agency conforming fixed-rate mortgage loans
and totaled $61.8 billion, $54.5 billion and $40.7 billion at December 31, 2010, 2009 and 2008, respectively.
Mortgage loans serviced for others are not included in loans on the accompanying Consolidated Balance Sheets.
During 2010, 2009 and 2008, BB&T sold residential mortgage loans from the held for sale portfolio with
unpaid principal balances of $19.1 billion, $25.8 billion and $13.4 billion, respectively, and recognized pre-tax gains
of $235 million, $357 million and $78 million, respectively, which were recorded in noninterest income as a
component of mortgage banking income. BB&T retained the related mortgage servicing rights and receives
servicing fees.
At December 31, 2010 and 2009, the approximate weighted average servicing fee was .35% and .37%,
respectively, of the outstanding balance of the residential mortgage loans. The weighted average coupon interest
rate on the portfolio of mortgage loans serviced for others was 5.26% and 5.57% at December 31, 2010 and 2009,
respectively. BB&T recognized servicing fees of $226 million, $190 million and $145 million during 2010, 2009 and
2008, respectively, as a component of mortgage banking income.
At December 31, 2010, and 2009, BB&T had $1.6 billion and $2.0 billion, respectively, of residential mortgage
loans sold with recourse liability. In the event of nonperformance by the borrower, BB&T has maximum recourse
exposure of approximately $597 million and $667 million as of December 31, 2010 and 2009, respectively. At
December 31, 2010 and 2009, BB&T has recorded $6 million of reserves related to these recourse exposures.
Payments made to date have been immaterial.
129