BB&T 2010 Annual Report Download - page 138
Download and view the complete annual report
Please find page 138 of the 2010 BB&T annual report below. You can navigate through the pages in the report by either clicking on the pages listed below, or by using the keyword search tool below to find specific information within the annual report.-
 1
1 -
2
-
3
-
4
-
5
-
6
-
7
-
8
-
9
-
10
-
11
-
12
-
13
-
14
-
15
-
16
-
17
-
18
-
19
-
20
-
21
-
22
-
23
-
24
-
25
-
26
-
27
-
28
-
29
-
30
-
31
-
32
-
33
-
34
-
35
-
36
-
37
-
38
-
39
-
40
-
41
-
42
-
43
-
44
-
45
-
46
-
47
-
48
-
49
-
50
-
51
-
52
-
53
-
54
-
55
-
56
-
57
-
58
-
59
-
60
-
61
-
62
-
63
-
64
-
65
-
66
-
67
-
68
-
69
-
70
-
71
-
72
-
73
-
74
-
75
-
76
-
77
-
78
-
79
-
80
-
81
-
82
-
83
-
84
-
85
-
86
-
87
-
88
-
89
-
90
-
91
-
92
-
93
-
94
-
95
-
96
-
97
-
98
-
99
-
100
-
101
-
102
-
103
-
104
-
105
-
106
-
107
-
108
-
109
-
110
-
111
-
112
-
113
-
114
-
115
-
116
-
117
-
118
-
119
-
120
-
121
-
122
-
123
-
124
-
125
-
126
-
127
-
 128
128 -
 129
129 -
 130
130 -
 131
131 -
 132
132 -
 133
133 -
 134
134 -
 135
135 -
 136
136 -
 137
137 -
 138
138 -
 139
139 -
 140
140 -
 141
141 -
 142
142 -
 143
143 -
 144
144 -
 145
145 -
 146
146 -
 147
147 -
 148
148 -
149
-
150
-
151
-
152
-
153
-
154
-
155
-
156
-
157
-
158
-
159
-
160
-
161
-
162
-
163
-
164
-
165
-
166
-
167
-
168
-
169
-
170
-
171
-
172
-
173
-
174
-
175
-
176
-
177
-
178
-
179
-
180
-
181
 |
 |

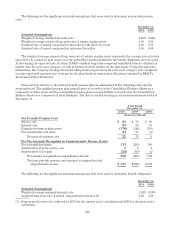
The following tables reflect the components of total comprehensive income for the years ended December 31,
2010, 2009 and 2008.
Year Ended December 31, 2010
Pre-Tax Tax Effect After-Tax
(Dollars in millions)
Comprehensive income:
Net income $ 969 $ 115 $ 854
Other comprehensive income:
Unrealized net holding gains (losses) arising during the period on
securities available for sale 667 252 415
Reclassification adjustment for losses (gains) on securities available
for sale included in net income (554) (207) (347)
Net change in amounts attributable to the FDIC under the loss share (251) (94) (157)
Net change in unrecognized gains (losses) on cash flow hedges (248) (94) (154)
Net change in foreign currency translation adjustment 1 (2) 3
Net change in pension and postretirement liability (140) (50) (90)
Total comprehensive income $ 444 $ (80) $ 524
Year Ended December 31, 2009
Pre-Tax Tax Effect After-Tax
(Dollars in millions)
Comprehensive income:
Net income $ 1,036 $ 159 $ 877
Other comprehensive income:
Unrealized net holding gains (losses) arising during the period on
securities available for sale 353 130 223
Reclassification adjustment for losses (gains) on securities available
for sale included in net income (199) (75) (124)
Net change in amounts attributable to the FDIC under the loss share (30) (11) (19)
Net change in unrecognized gains (losses) on cash flow hedges 97 38 59
Net change in foreign currency translation adjustment 2 (5) 7
Net change in pension and postretirement liability 273 104 169
Total comprehensive income $ 1,532 $ 340 $ 1,192
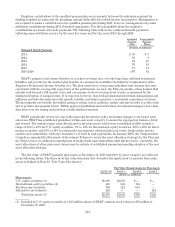
Year Ended December 31, 2008
Pre-Tax Tax Effect After-Tax
(Dollars in millions)
Comprehensive income:
Net income $ 2,079 $ 550 $ 1,529
Other comprehensive income:
Unrealized net holding gains (losses) arising during the period on
securities available for sale (365) (136) (229)
Reclassification adjustment for losses (gains) on securities available
for sale included in net income (107) (40) (67)
Net change in unrecognized gains (losses) on cash flow hedges 76 28 48
Net change in foreign currency translation adjustment (12) — (12)
Net change in pension and postretirement liability (593) (225) (368)
Total comprehensive income $ 1,078 $ 177 $ 901
138