BB&T 2010 Annual Report Download - page 16
Download and view the complete annual report
Please find page 16 of the 2010 BB&T annual report below. You can navigate through the pages in the report by either clicking on the pages listed below, or by using the keyword search tool below to find specific information within the annual report.-
 1
1 -
2
-
3
-
4
-
5
-
 6
6 -
 7
7 -
 8
8 -
 9
9 -
 10
10 -
 11
11 -
 12
12 -
 13
13 -
 14
14 -
 15
15 -
 16
16 -
 17
17 -
 18
18 -
 19
19 -
 20
20 -
 21
21 -
 22
22 -
 23
23 -
 24
24 -
 25
25 -
 26
26 -
27
-
28
-
29
-
30
-
31
-
32
-
33
-
34
-
35
-
36
-
37
-
38
-
39
-
40
-
41
-
42
-
43
-
44
-
45
-
46
-
47
-
48
-
49
-
50
-
51
-
52
-
53
-
54
-
55
-
56
-
57
-
58
-
59
-
60
-
61
-
62
-
63
-
64
-
65
-
66
-
67
-
68
-
69
-
70
-
71
-
72
-
73
-
74
-
75
-
76
-
77
-
78
-
79
-
80
-
81
-
82
-
83
-
84
-
85
-
86
-
87
-
88
-
89
-
90
-
91
-
92
-
93
-
94
-
95
-
96
-
97
-
98
-
99
-
100
-
101
-
102
-
103
-
104
-
105
-
106
-
107
-
108
-
109
-
110
-
111
-
112
-
113
-
114
-
115
-
116
-
117
-
118
-
119
-
120
-
121
-
122
-
123
-
124
-
125
-
126
-
127
-
128
-
129
-
130
-
131
-
132
-
133
-
134
-
135
-
136
-
137
-
138
-
139
-
140
-
141
-
142
-
143
-
144
-
145
-
146
-
147
-
148
-
149
-
150
-
151
-
152
-
153
-
154
-
155
-
156
-
157
-
158
-
159
-
160
-
161
-
162
-
163
-
164
-
165
-
166
-
167
-
168
-
169
-
170
-
171
-
172
-
173
-
174
-
175
-
176
-
177
-
178
-
179
-
180
-
181
 |
 |

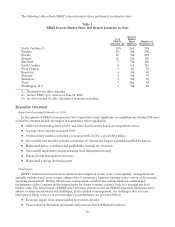
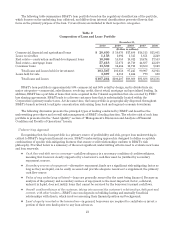
The following table reflects BB&T’s deposit market share and branch locations by state.
Table 1
BB&T Deposit Market Share and Branch Locations by State
%of
BB&T's
Deposits (2)
Deposit
Market
Share
Rank (2) Number of
Branches (3)
North Carolina (1) 23% 2nd 359
Virginia 20 4th 392
Florida 15 5th 271
Georgia 11 5th 169
Maryland 7 7th 130
South Carolina 6 3rd 115
West Virginia 5 1st 78
Kentucky 4 4th 89
Alabama 4 5th 87
Tennessee 3 6th 56
Texas 1 51st 22
Washington, D.C. 1 7th 12
(1) Excludes home office deposits.
(2) Source: FDIC.gov—data as of June 30, 2010.
(3) As of December 31, 2010. Excludes 2 branches in Indiana.
Executive Overview
Significant accomplishments in 2010
In the opinion of BB&T’s management, the Corporation’s most significant accomplishments during 2010 were
as follows (amounts include the impact of acquisitions where applicable):
ŠAchieved outstanding client service and client loyalty scores based on independent survey
ŠAverage client deposits increased 9.2%
ŠProduced fully taxable-equivalent revenue growth of 5.8%, a record $9.4 billion
ŠSuccessfully executed the systems conversion of Colonial, the largest acquisition in BB&T’s history
ŠMaintained safety, soundness and profitability through the recession
ŠSuccessfully implemented nonperforming asset disposition strategy
ŠEnhanced risk management structure
ŠMaintained a strong dividend payout
Challenges
BB&T’s business has become more dynamic and complex in recent years. Consequently, management has
annually evaluated and, as necessary, adjusted the Corporation’s business strategy in the context of the current
operating environment. During this process, management considers the current financial condition and
performance of the Company and its expectations for future economic activity, both on a national and local
market scale. The achievement of BB&T’s key strategic objectives and established long-term financial goals is
subject to many uncertainties and challenges. In the opinion of management, the challenges that are most
relevant and likely to have a near term impact on performance are presented below:
ŠEconomic impact from deepest global recession in decades
ŠUnprecedented disruption and significantly increased risk in financial markets
16