Bank of America 2015 Annual Report Download - page 10
Download and view the complete annual report
Please find page 10 of the 2015 Bank of America annual report below. You can navigate through the pages in the report by either clicking on the pages listed below, or by using the keyword search tool below to find specific information within the annual report.-
 1
1 -
 2
2 -
 3
3 -
 4
4 -
 5
5 -
 6
6 -
 7
7 -
 8
8 -
 9
9 -
 10
10 -
 11
11 -
 12
12 -
 13
13 -
 14
14 -
 15
15 -
 16
16 -
 17
17 -
 18
18 -
 19
19 -
 20
20 -
 21
21 -
22
-
23
-
24
-
25
-
26
-
27
-
28
-
29
-
30
-
31
-
32
-
33
-
34
-
35
-
36
-
37
-
38
-
39
-
40
-
41
-
42
-
43
-
44
-
45
-
46
-
47
-
48
-
49
-
50
-
51
-
52
-
53
-
54
-
55
-
56
-
57
-
58
-
59
-
60
-
61
-
62
-
63
-
64
-
65
-
66
-
67
-
68
-
69
-
70
-
71
-
72
-
73
-
74
-
75
-
76
-
77
-
78
-
79
-
80
-
81
-
82
-
83
-
84
-
85
-
86
-
87
-
88
-
89
-
90
-
91
-
92
-
93
-
94
-
95
-
96
-
97
-
98
-
99
-
100
-
101
-
102
-
103
-
104
-
105
-
106
-
107
-
108
-
109
-
110
-
111
-
112
-
113
-
114
-
115
-
116
-
117
-
118
-
119
-
120
-
121
-
122
-
123
-
124
-
125
-
126
-
127
-
128
-
129
-
130
-
131
-
132
-
133
-
134
-
135
-
136
-
137
-
138
-
139
-
140
-
141
-
142
-
143
-
144
-
145
-
146
-
147
-
148
-
149
-
150
-
151
-
152
-
153
-
154
-
155
-
156
-
157
-
158
-
159
-
160
-
161
-
162
-
163
-
164
-
165
-
166
-
167
-
168
-
169
-
170
-
171
-
172
-
173
-
174
-
175
-
176
-
177
-
178
-
179
-
180
-
181
-
182
-
183
-
184
-
185
-
186
-
187
-
188
-
189
-
190
-
191
-
192
-
193
-
194
-
195
-
196
-
197
-
198
-
199
-
200
-
201
-
202
-
203
-
204
-
205
-
206
-
207
-
208
-
209
-
210
-
211
-
212
-
213
-
214
-
215
-
216
-
217
-
218
-
219
-
220
-
221
-
222
-
223
-
224
-
225
-
226
-
227
-
228
-
229
-
230
-
231
-
232
-
233
-
234
-
235
-
236
-
237
-
238
-
239
-
240
-
241
-
242
-
243
-
244
-
245
-
246
-
247
-
248
-
249
-
250
-
251
-
252
-
253
-
254
-
255
-
256
 |
 |
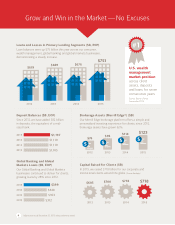
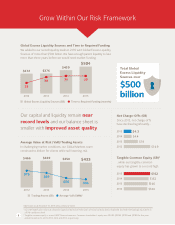
$4.3
$4.4
$7.9
$14.9
2012
2013
2014
2015
$162
$152
$146
$144
2012
2013
2014
2015
Our capital and liquidity remain near
record levels and our balance sheet is
smaller with improved asset quality.
Grow Within Our Risk Framework
Global Excess Liquidity Sources and Time to Required Funding
We added to our record liquidity levels in with Global Excess Liquidity
Sources of more than $ billion. We have enough parent liquidity to last
more than three years before we would need market funding.
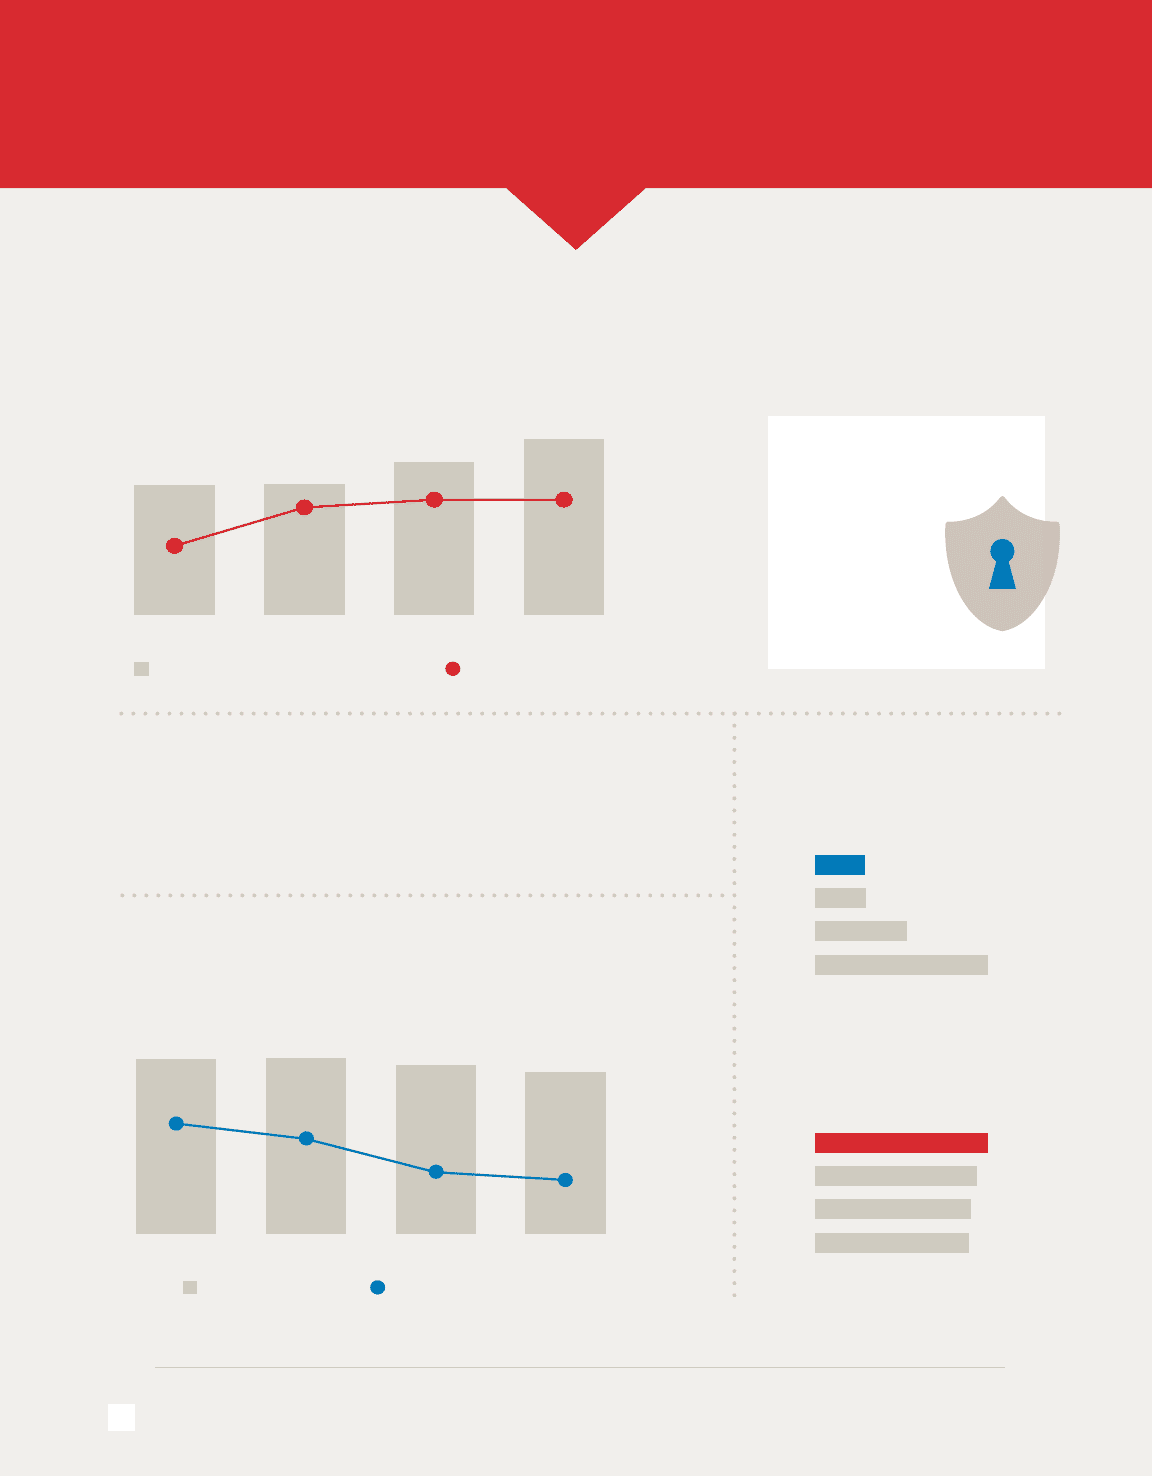
Average Value at Risk (VaR)/Trading Assets
In challenging market conditions, our Global Markets team
continued to deliver for clients while still lowering risk.
Tangible Common Equity ($B)
…while our tangible common
equity has grown to a record high.
Net Charge-Offs ($B)
Since , net charge-offs
have declined significantly…
Total Global
Excess Liquidity
Sources over
$500
billion
2012 2013 2014 2015
Time to Required Funding (months)Global Excess Liquidity Sources ($B)
$504
33
$439
$376
$372
3939
38
2012 2013 2014 2015
Average VaR ($MM)
1
Trading Assets ($B)
$53
$56
$69
$75
$469
$466 $450 $433
Information as of December 31, 2015 unless otherwise noted.
Our VaR model uses historical simulation approach based on three years of historical data and an expected shortfall methodology equivalent to
a % confidence level.
Tangible common equity is a non-GAAP financial measure. Common shareholders’ equity was $B, $B, $B and $B for the years
ended December , , , and , respectively.
8