Bank of America 2015 Annual Report Download - page 247
Download and view the complete annual report
Please find page 247 of the 2015 Bank of America annual report below. You can navigate through the pages in the report by either clicking on the pages listed below, or by using the keyword search tool below to find specific information within the annual report.-
 1
1 -
2
-
3
-
4
-
5
-
6
-
7
-
8
-
9
-
10
-
11
-
12
-
13
-
14
-
15
-
16
-
17
-
18
-
19
-
20
-
21
-
22
-
23
-
24
-
25
-
26
-
27
-
28
-
29
-
30
-
31
-
32
-
33
-
34
-
35
-
36
-
37
-
38
-
39
-
40
-
41
-
42
-
43
-
44
-
45
-
46
-
47
-
48
-
49
-
50
-
51
-
52
-
53
-
54
-
55
-
56
-
57
-
58
-
59
-
60
-
61
-
62
-
63
-
64
-
65
-
66
-
67
-
68
-
69
-
70
-
71
-
72
-
73
-
74
-
75
-
76
-
77
-
78
-
79
-
80
-
81
-
82
-
83
-
84
-
85
-
86
-
87
-
88
-
89
-
90
-
91
-
92
-
93
-
94
-
95
-
96
-
97
-
98
-
99
-
100
-
101
-
102
-
103
-
104
-
105
-
106
-
107
-
108
-
109
-
110
-
111
-
112
-
113
-
114
-
115
-
116
-
117
-
118
-
119
-
120
-
121
-
122
-
123
-
124
-
125
-
126
-
127
-
128
-
129
-
130
-
131
-
132
-
133
-
134
-
135
-
136
-
137
-
138
-
139
-
140
-
141
-
142
-
143
-
144
-
145
-
146
-
147
-
148
-
149
-
150
-
151
-
152
-
153
-
154
-
155
-
156
-
157
-
158
-
159
-
160
-
161
-
162
-
163
-
164
-
165
-
166
-
167
-
168
-
169
-
170
-
171
-
172
-
173
-
174
-
175
-
176
-
177
-
178
-
179
-
180
-
181
-
182
-
183
-
184
-
185
-
186
-
187
-
188
-
189
-
190
-
191
-
192
-
193
-
194
-
195
-
196
-
197
-
198
-
199
-
200
-
201
-
202
-
203
-
204
-
205
-
206
-
207
-
208
-
209
-
210
-
211
-
212
-
213
-
214
-
215
-
216
-
217
-
218
-
219
-
220
-
221
-
222
-
223
-
224
-
225
-
226
-
227
-
228
-
229
-
230
-
231
-
232
-
233
-
234
-
235
-
236
-
 237
237 -
 238
238 -
 239
239 -
 240
240 -
 241
241 -
 242
242 -
 243
243 -
 244
244 -
 245
245 -
 246
246 -
 247
247 -
 248
248 -
 249
249 -
 250
250 -
 251
251 -
 252
252 -
 253
253 -
 254
254 -
 255
255 -
 256
256
 |
 |

Bank of America 2015 245
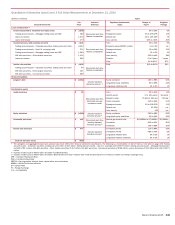
The table below presents net income (loss) and the components thereto (with net interest income on an FTE basis) for 2015, 2014
and 2013, and total assets at December 31, 2015 and 2014 for each business segment, as well as All Other.
Results for Business Segments and All Other
At and for the Year Ended December 31 Total Corporation (1) Consumer Banking
Global Wealth &
Investment Management
(Dollars in millions) 2015 2014 2013 2015 2014 2013 2015 2014 2013
Net interest income (FTE basis) $ 40,160 $ 40,821 $ 43,124 $ 19,844 $ 20,177 $ 20,619 $ 5,499 $ 5,836 $ 6,064
Noninterest income 43,256 44,295 46,677 10,774 10,632 11,313 12,502 12,568 11,726
Total revenue, net of interest expense (FTE basis) 83,416 85,116 89,801 30,618 30,809 31,932 18,001 18,404 17,790
Provision for credit losses 3,161 2,275 3,556 2,524 2,680 3,166 51 14 56
Noninterest expense 57,192 75,117 69,214 17,485 17,865 18,865 13,843 13,654 13,039
Income before income taxes (FTE basis) 23,063 7,724 17,031 10,609 10,264 9,901 4,107 4,736 4,695
Income tax expense (FTE basis) 7,175 2,891 5,600 3,870 3,828 3,630 1,498 1,767 1,722
Net income $ 15,888 $ 4,833 $ 11,431 $ 6,739 $ 6,436 $ 6,271 $ 2,609 $ 2,969 $ 2,973
Year-end total assets $ 2,144,316 $ 2,104,534 $ 636,464 $588,878 $ 296,139 $274,887
Global Banking Global Markets
2015 2014 2013 2015 2014 2013
Net interest income (FTE basis) $ 9,254 $ 9,810 $ 9,692 $ 4,338 $ 4,004 $ 4,237
Noninterest income 7,665 7,797 7,744 10,729 12,184 11,221
Total revenue, net of interest expense (FTE basis) 16,919 17,607 17,436 15,067 16,188 15,458
Provision for credit losses 685 322 1,142 99 110 140
Noninterest expense 7,888 8,170 8,051 11,310 11,862 12,094
Income before income taxes (FTE basis) 8,346 9,115 8,243 3,658 4,216 3,224
Income tax expense (FTE basis) 3,073 3,346 3,024 1,162 1,511 2,090
Net income $ 5,273 $ 5,769 $ 5,219 $ 2,496 $ 2,705 $ 1,134
Year-end total assets $ 382,043 $353,637 $ 551,587 $579,594
Legacy Assets & Servicing All Other
2015 2014 2013 2015 2014 2013
Net interest income (FTE basis) $ 1,573 $ 1,520 $ 1,552 $ (348) $ (526) $ 960
Noninterest income 1,857 1,156 2,872 (271) (42) 1,801
Total revenue, net of interest expense (FTE basis) 3,430 2,676 4,424 (619) (568) 2,761
Provision for credit losses 144 127 (283) (342) (978) (665)
Noninterest expense 4,451 20,633 12,416 2,215 2,933 4,749
Loss before income taxes (FTE basis) (1,165) (18,084) (7,709) (2,492)(2,523) (1,323)
Income tax benefit (FTE basis) (425) (4,974) (2,826) (2,003)(2,587) (2,040)
Net income (loss) $ (740) $ (13,110) $ (4,883) $ (489) $ 64 $ 717
Year-end total assets $ 47,292 $ 45,957 $ 230,791 $261,581
(1) There were no material intersegment revenues.