Bank of America 2015 Annual Report Download - page 115
Download and view the complete annual report
Please find page 115 of the 2015 Bank of America annual report below. You can navigate through the pages in the report by either clicking on the pages listed below, or by using the keyword search tool below to find specific information within the annual report.-
 1
1 -
2
-
3
-
4
-
5
-
6
-
7
-
8
-
9
-
10
-
11
-
12
-
13
-
14
-
15
-
16
-
17
-
18
-
19
-
20
-
21
-
22
-
23
-
24
-
25
-
26
-
27
-
28
-
29
-
30
-
31
-
32
-
33
-
34
-
35
-
36
-
37
-
38
-
39
-
40
-
41
-
42
-
43
-
44
-
45
-
46
-
47
-
48
-
49
-
50
-
51
-
52
-
53
-
54
-
55
-
56
-
57
-
58
-
59
-
60
-
61
-
62
-
63
-
64
-
65
-
66
-
67
-
68
-
69
-
70
-
71
-
72
-
73
-
74
-
75
-
76
-
77
-
78
-
79
-
80
-
81
-
82
-
83
-
84
-
85
-
86
-
87
-
88
-
89
-
90
-
91
-
92
-
93
-
94
-
95
-
96
-
97
-
98
-
99
-
100
-
101
-
102
-
103
-
104
-
 105
105 -
 106
106 -
 107
107 -
 108
108 -
 109
109 -
 110
110 -
 111
111 -
 112
112 -
 113
113 -
 114
114 -
 115
115 -
 116
116 -
 117
117 -
 118
118 -
 119
119 -
 120
120 -
 121
121 -
 122
122 -
 123
123 -
 124
124 -
 125
125 -
126
-
127
-
128
-
129
-
130
-
131
-
132
-
133
-
134
-
135
-
136
-
137
-
138
-
139
-
140
-
141
-
142
-
143
-
144
-
145
-
146
-
147
-
148
-
149
-
150
-
151
-
152
-
153
-
154
-
155
-
156
-
157
-
158
-
159
-
160
-
161
-
162
-
163
-
164
-
165
-
166
-
167
-
168
-
169
-
170
-
171
-
172
-
173
-
174
-
175
-
176
-
177
-
178
-
179
-
180
-
181
-
182
-
183
-
184
-
185
-
186
-
187
-
188
-
189
-
190
-
191
-
192
-
193
-
194
-
195
-
196
-
197
-
198
-
199
-
200
-
201
-
202
-
203
-
204
-
205
-
206
-
207
-
208
-
209
-
210
-
211
-
212
-
213
-
214
-
215
-
216
-
217
-
218
-
219
-
220
-
221
-
222
-
223
-
224
-
225
-
226
-
227
-
228
-
229
-
230
-
231
-
232
-
233
-
234
-
235
-
236
-
237
-
238
-
239
-
240
-
241
-
242
-
243
-
244
-
245
-
246
-
247
-
248
-
249
-
250
-
251
-
252
-
253
-
254
-
255
-
256
 |
 |

Bank of America 2015 113
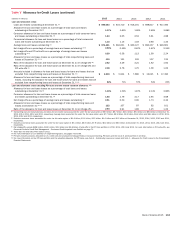
Table V Allowance for Credit Losses (continued)
(Dollars in millions) 2015 2014 2013 2012 2011
Loan and allowance ratios:
Loans and leases outstanding at December 31 (5) $ 896,063 $ 872,710 $ 918,191 $ 898,817 $ 917,396
Allowance for loan and lease losses as a percentage of total loans and leases
outstanding at December 31 (5) 1.37%1.65% 1.90% 2.69% 3.68%
Consumer allowance for loan and lease losses as a percentage of total consumer loans
and leases outstanding at December 31 (6) 1.63 2.05 2.53 3.81 4.88
Commercial allowance for loan and lease losses as a percentage of total commercial
loans and leases outstanding at December 31 (7) 1.10 1.15 1.03 0.90 1.33
Average loans and leases outstanding (5) $ 874,461 $ 894,001 $ 909,127 $ 890,337 $ 929,661
Net charge-offs as a percentage of average loans and leases outstanding (5, 8) 0.50%0.49% 0.87% 1.67% 2.24%
Net charge-offs and PCI write-offs as a percentage of average loans and leases
outstanding (5, 9) 0.59 0.58 1.13 1.99 2.24
Allowance for loan and lease losses as a percentage of total nonperforming loans and
leases at December 31 (5, 10) 130 121 102 107 135
Ratio of the allowance for loan and lease losses at December 31 to net charge-offs (8) 2.82 3.29 2.21 1.62 1.62
Ratio of the allowance for loan and lease losses at December 31 to net charge-offs and
PCI write-offs (9) 2.38 2.78 1.70 1.36 1.62
Amounts included in allowance for loan and lease losses for loans and leases that are
excluded from nonperforming loans and leases at December 31 (11) $ 4,518 $ 5,944 $ 7,680 $ 12,021 $ 17,490
Allowance for loan and lease losses as a percentage of total nonperforming loans and
leases, excluding the allowance for loan and lease losses for loans and leases that are
excluded from nonperforming loans and leases at December 31 (5, 11) 82% 71% 57% 54% 65%
Loan and allowance ratios excluding PCI loans and the related valuation allowance: (12)
Allowance for loan and lease losses as a percentage of total loans and leases
outstanding at December 31 (5) 1.30%1.50% 1.67% 2.14% 2.86%
Consumer allowance for loan and lease losses as a percentage of total consumer loans
and leases outstanding at December 31 (6) 1.50 1.79 2.17 2.95 3.68
Net charge-offs as a percentage of average loans and leases outstanding (5) 0.51 0.50 0.90 1.73 2.32
Allowance for loan and lease losses as a percentage of total nonperforming loans and
leases at December 31 (5, 10) 122 107 87 82 101
Ratio of the allowance for loan and lease losses at December 31 to net charge-offs 2.64 2.91 1.89 1.25 1.22
(5) Outstanding loan and lease balances and ratios do not include loans accounted for under the fair value option of $6.9 billion, $8.7 billion, $10.0 billion, $9.0 billion and $8.8 billion at December 31,
2015, 2014, 2013, 2012 and 2011, respectively. Average loans accounted for under the fair value option were $7.7 billion, $9.9 billion, $9.5 billion, $8.4 billion and $8.4 billion in 2015, 2014,
2013, 2012 and 2011, respectively.
(6) Excludes consumer loans accounted for under the fair value option of $1.9 billion, $2.1 billion, $2.2 billion, $1.0 billion and $2.2 billion at December 31, 2015, 2014, 2013, 2012 and 2011,
respectively.
(7) Excludes commercial loans accounted for under the fair value option of $5.1 billion, $6.6 billion, $7.9 billion, $8.0 billion and $6.6 billion at December 31, 2015, 2014, 2013, 2012 and 2011,
respectively.
(8) Net charge-offs exclude $808 million, $810 million, $2.3 billion and $2.8 billion of write-offs in the PCI loan portfolio in 2015, 2014, 2013 and 2012. For more information on PCI write-offs, see
Consumer Portfolio Credit Risk Management – Purchased Credit-impaired Loan Portfolio on page 71.
(9) There were no write-offs of PCI loans in 2011.
(10) For more information on our definition of nonperforming loans, see pages 73 and 80.
(11) Primarily includes amounts allocated to U.S. credit card and unsecured lending portfolios in Consumer Banking, PCI loans and the non-U.S. credit portfolio in All Other.
(12) For more information on the PCI loan portfolio and the valuation allowance for PCI loans, see Note 4 – Outstanding Loans and Leases and Note 5 – Allowance for Credit Losses to the Consolidated
Financial Statements.