Bank of America 2015 Annual Report Download - page 180
Download and view the complete annual report
Please find page 180 of the 2015 Bank of America annual report below. You can navigate through the pages in the report by either clicking on the pages listed below, or by using the keyword search tool below to find specific information within the annual report.-
 1
1 -
2
-
3
-
4
-
5
-
6
-
7
-
8
-
9
-
10
-
11
-
12
-
13
-
14
-
15
-
16
-
17
-
18
-
19
-
20
-
21
-
22
-
23
-
24
-
25
-
26
-
27
-
28
-
29
-
30
-
31
-
32
-
33
-
34
-
35
-
36
-
37
-
38
-
39
-
40
-
41
-
42
-
43
-
44
-
45
-
46
-
47
-
48
-
49
-
50
-
51
-
52
-
53
-
54
-
55
-
56
-
57
-
58
-
59
-
60
-
61
-
62
-
63
-
64
-
65
-
66
-
67
-
68
-
69
-
70
-
71
-
72
-
73
-
74
-
75
-
76
-
77
-
78
-
79
-
80
-
81
-
82
-
83
-
84
-
85
-
86
-
87
-
88
-
89
-
90
-
91
-
92
-
93
-
94
-
95
-
96
-
97
-
98
-
99
-
100
-
101
-
102
-
103
-
104
-
105
-
106
-
107
-
108
-
109
-
110
-
111
-
112
-
113
-
114
-
115
-
116
-
117
-
118
-
119
-
120
-
121
-
122
-
123
-
124
-
125
-
126
-
127
-
128
-
129
-
130
-
131
-
132
-
133
-
134
-
135
-
136
-
137
-
138
-
139
-
140
-
141
-
142
-
143
-
144
-
145
-
146
-
147
-
148
-
149
-
150
-
151
-
152
-
153
-
154
-
155
-
156
-
157
-
158
-
159
-
160
-
161
-
162
-
163
-
164
-
165
-
166
-
167
-
168
-
169
-
 170
170 -
 171
171 -
 172
172 -
 173
173 -
 174
174 -
 175
175 -
 176
176 -
 177
177 -
 178
178 -
 179
179 -
 180
180 -
 181
181 -
 182
182 -
 183
183 -
 184
184 -
 185
185 -
 186
186 -
 187
187 -
 188
188 -
 189
189 -
 190
190 -
191
-
192
-
193
-
194
-
195
-
196
-
197
-
198
-
199
-
200
-
201
-
202
-
203
-
204
-
205
-
206
-
207
-
208
-
209
-
210
-
211
-
212
-
213
-
214
-
215
-
216
-
217
-
218
-
219
-
220
-
221
-
222
-
223
-
224
-
225
-
226
-
227
-
228
-
229
-
230
-
231
-
232
-
233
-
234
-
235
-
236
-
237
-
238
-
239
-
240
-
241
-
242
-
243
-
244
-
245
-
246
-
247
-
248
-
249
-
250
-
251
-
252
-
253
-
254
-
255
-
256
 |
 |

178 Bank of America 2015
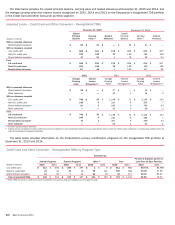
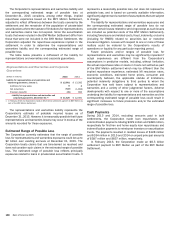
The table below presents the allowance and the carrying value of outstanding loans and leases by portfolio segment at December
31, 2015 and 2014.
Allowance and Carrying Value by Portfolio Segment
December 31, 2015
(Dollars in millions)
Consumer
Real Estate
Credit Card
and Other
Consumer Commercial Total
Impaired loans and troubled debt restructurings (1)
Allowance for loan and lease losses (2) $634 $250 $217 $ 1,101
Carrying value (3) 21,058 779 2,368 24,205
Allowance as a percentage of carrying value 3.01% 32.09% 9.16% 4.55%
Loans collectively evaluated for impairment
Allowance for loan and lease losses $ 2,476 $ 3,221 $ 4,632 $ 10,329
Carrying value (3, 4) 226,116 189,660 439,397 855,173
Allowance as a percentage of carrying value (4) 1.10%1.70%1.05% 1.21%
Purchased credit-impaired loans
Valuation allowance $804 n/a n/a $ 804
Carrying value gross of valuation allowance 16,685 n/a n/a 16,685
Valuation allowance as a percentage of carrying value 4.82% n/a n/a 4.82%
Total
Allowance for loan and lease losses $ 3,914 $ 3,471 $ 4,849 $ 12,234
Carrying value (3, 4) 263,859 190,439 441,765 896,063
Allowance as a percentage of carrying value (4) 1.48%1.82%1.10% 1.37%
December 31, 2014
Impaired loans and troubled debt restructurings (1)
Allowance for loan and lease losses (2) $ 727 $ 339 $ 159 $ 1,225
Carrying value (3) 25,628 1,141 2,198 28,967
Allowance as a percentage of carrying value 2.84% 29.71% 7.23% 4.23%
Loans collectively evaluated for impairment
Allowance for loan and lease losses $ 3,556 $ 3,708 $ 4,278 $ 11,542
Carrying value (3, 4) 255,525 183,430 384,019 822,974
Allowance as a percentage of carrying value (4) 1.39% 2.02% 1.11% 1.40%
Purchased credit-impaired loans
Valuation allowance $ 1,652 n/a n/a $ 1,652
Carrying value gross of valuation allowance 20,769 n/a n/a 20,769
Valuation allowance as a percentage of carrying value 7.95% n/a n/a 7.95%
Total
Allowance for loan and lease losses $ 5,935 $ 4,047 $ 4,437 $ 14,419
Carrying value (3, 4) 301,922 184,571 386,217 872,710
Allowance as a percentage of carrying value (4) 1.97% 2.19% 1.15% 1.65%
(1) Impaired loans include nonperforming commercial loans and all TDRs, including both commercial and consumer TDRs. Impaired loans exclude nonperforming consumer loans unless they are TDRs,
and all consumer and commercial loans accounted for under the fair value option.
(2) Allowance for loan and lease losses includes $35 million related to impaired U.S. small business commercial at both December 31, 2015 and 2014.
(3) Amounts are presented gross of the allowance for loan and lease losses.
(4) Outstanding loan and lease balances and ratios do not include loans accounted for under the fair value option of $6.9 billion and $8.7 billion at December 31, 2015 and 2014.
n/a = not applicable