Bank of America 2015 Annual Report Download - page 183
Download and view the complete annual report
Please find page 183 of the 2015 Bank of America annual report below. You can navigate through the pages in the report by either clicking on the pages listed below, or by using the keyword search tool below to find specific information within the annual report.-
 1
1 -
2
-
3
-
4
-
5
-
6
-
7
-
8
-
9
-
10
-
11
-
12
-
13
-
14
-
15
-
16
-
17
-
18
-
19
-
20
-
21
-
22
-
23
-
24
-
25
-
26
-
27
-
28
-
29
-
30
-
31
-
32
-
33
-
34
-
35
-
36
-
37
-
38
-
39
-
40
-
41
-
42
-
43
-
44
-
45
-
46
-
47
-
48
-
49
-
50
-
51
-
52
-
53
-
54
-
55
-
56
-
57
-
58
-
59
-
60
-
61
-
62
-
63
-
64
-
65
-
66
-
67
-
68
-
69
-
70
-
71
-
72
-
73
-
74
-
75
-
76
-
77
-
78
-
79
-
80
-
81
-
82
-
83
-
84
-
85
-
86
-
87
-
88
-
89
-
90
-
91
-
92
-
93
-
94
-
95
-
96
-
97
-
98
-
99
-
100
-
101
-
102
-
103
-
104
-
105
-
106
-
107
-
108
-
109
-
110
-
111
-
112
-
113
-
114
-
115
-
116
-
117
-
118
-
119
-
120
-
121
-
122
-
123
-
124
-
125
-
126
-
127
-
128
-
129
-
130
-
131
-
132
-
133
-
134
-
135
-
136
-
137
-
138
-
139
-
140
-
141
-
142
-
143
-
144
-
145
-
146
-
147
-
148
-
149
-
150
-
151
-
152
-
153
-
154
-
155
-
156
-
157
-
158
-
159
-
160
-
161
-
162
-
163
-
164
-
165
-
166
-
167
-
168
-
169
-
170
-
171
-
172
-
 173
173 -
 174
174 -
 175
175 -
 176
176 -
 177
177 -
 178
178 -
 179
179 -
 180
180 -
 181
181 -
 182
182 -
 183
183 -
 184
184 -
 185
185 -
 186
186 -
 187
187 -
 188
188 -
 189
189 -
 190
190 -
 191
191 -
 192
192 -
 193
193 -
194
-
195
-
196
-
197
-
198
-
199
-
200
-
201
-
202
-
203
-
204
-
205
-
206
-
207
-
208
-
209
-
210
-
211
-
212
-
213
-
214
-
215
-
216
-
217
-
218
-
219
-
220
-
221
-
222
-
223
-
224
-
225
-
226
-
227
-
228
-
229
-
230
-
231
-
232
-
233
-
234
-
235
-
236
-
237
-
238
-
239
-
240
-
241
-
242
-
243
-
244
-
245
-
246
-
247
-
248
-
249
-
250
-
251
-
252
-
253
-
254
-
255
-
256
 |
 |

Bank of America 2015 181
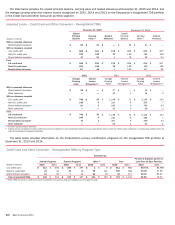
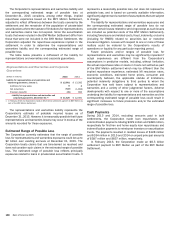
Other Asset-backed Securitizations
The table below summarizes select information related to home equity loan, credit card and other asset-backed VIEs in which the
Corporation held a variable interest at December 31, 2015 and 2014.
Home Equity Loan, Credit Card and Other Asset-backed VIEs
Home Equity Loan (1) Credit Card (2, 3)
Resecuritization
Trusts
Municipal Bond
Trusts
Automobile and Other
Securitization Trusts
December 31
(Dollars in millions) 2015 2014 2015 2014 2015 2014 2015 2014 2015 2014
Unconsolidated VIEs
Maximum loss exposure $ 3,988 $ 4,801 $—
$—
$ 13,043 $ 8,569 $ 1,572 $ 2,100 $63 $ 77
On-balance sheet assets
Senior securities held (4, 5):
Trading account assets $—
$ 12 $—
$—
$ 1,248 $ 767 $2
$ 25 $—$6
Debt securities carried at fair value ————4,341 6,945 ——53 61
Held-to-maturity securities ————7,367 740 ————
Subordinate securities held (4, 5):
Trading account assets —2——17 44 ————
Debt securities carried at fair value 57 39 ——70 73 ————
All other assets ————————10 10
Total retained positions $ 57 $ 53 $—
$—
$ 13,043 $ 8,569 $2
$ 25 $63 $ 77
Total assets of VIEs (6) $ 5,883 $ 6,362 $—
$—
$ 35,362 $ 28,065 $ 2,518 $ 3,314 $314 $ 1,276
Consolidated VIEs
Maximum loss exposure $ 231 $ 991 $ 32,678 $ 43,139 $354 $ 654 $ 1,973 $ 2,440 $—$ 92
On-balance sheet assets
Trading account assets $—
$—
$—
$—
$771 $ 1,295 $ 1,984 $ 2,452 $—$—
Loans and leases 321 1,014 43,194 53,068 ——————
Allowance for loan and lease losses (18) (56) (1,293) (1,904) ——————
Loans held-for-sale —————————555
All other assets 20 33 342 392 ——1——54
Total assets $ 323 $ 991 $ 42,243 $ 51,556 $771 $ 1,295 $ 1,985 $ 2,452 $—$ 609
On-balance sheet liabilities
Short-term borrowings $—
$—
$—
$—
$—
$—
$681 $ 1,032 $—$—
Long-term debt 183 1,076 9,550 8,401 417 641 12 12 —516
All other liabilities ——15 16 —————1
Total liabilities $ 183 $ 1,076 $ 9,565 $ 8,417 $417 $ 641 $693 $ 1,044 $—$ 517
(1) For unconsolidated home equity loan VIEs, the maximum loss exposure includes outstanding trust certificates issued by trusts in rapid amortization, net of recorded reserves. For both consolidated
and unconsolidated home equity loan VIEs, the maximum loss exposure excludes the liability for representations and warranties obligations and corporate guarantees. For additional information,
see Note 7 – Representations and Warranties Obligations and Corporate Guarantees.
(2) At December 31, 2015 and 2014, loans and leases in the consolidated credit card trust included $24.7 billion and $36.9 billion of seller’s interest.
(3) At December 31, 2015 and 2014, all other assets in the consolidated credit card trust included restricted cash, certain short-term investments, and unbilled accrued interest and fees.
(4) As a holder of these securities, the Corporation receives scheduled principal and interest payments. During 2015 and 2014, there were no OTTI losses recorded on those securities classified as
AFS or HTM debt securities.
(5) The retained senior and subordinate securities were valued using quoted market prices or observable market inputs (Level 2 of the fair value hierarchy).
(6) Total assets include loans the Corporation transferred with which it has continuing involvement, which may include servicing the loan.