Bank of America 2015 Annual Report Download - page 125
Download and view the complete annual report
Please find page 125 of the 2015 Bank of America annual report below. You can navigate through the pages in the report by either clicking on the pages listed below, or by using the keyword search tool below to find specific information within the annual report.-
 1
1 -
2
-
3
-
4
-
5
-
6
-
7
-
8
-
9
-
10
-
11
-
12
-
13
-
14
-
15
-
16
-
17
-
18
-
19
-
20
-
21
-
22
-
23
-
24
-
25
-
26
-
27
-
28
-
29
-
30
-
31
-
32
-
33
-
34
-
35
-
36
-
37
-
38
-
39
-
40
-
41
-
42
-
43
-
44
-
45
-
46
-
47
-
48
-
49
-
50
-
51
-
52
-
53
-
54
-
55
-
56
-
57
-
58
-
59
-
60
-
61
-
62
-
63
-
64
-
65
-
66
-
67
-
68
-
69
-
70
-
71
-
72
-
73
-
74
-
75
-
76
-
77
-
78
-
79
-
80
-
81
-
82
-
83
-
84
-
85
-
86
-
87
-
88
-
89
-
90
-
91
-
92
-
93
-
94
-
95
-
96
-
97
-
98
-
99
-
100
-
101
-
102
-
103
-
104
-
105
-
106
-
107
-
108
-
109
-
110
-
111
-
112
-
113
-
114
-
 115
115 -
 116
116 -
 117
117 -
 118
118 -
 119
119 -
 120
120 -
 121
121 -
 122
122 -
 123
123 -
 124
124 -
 125
125 -
 126
126 -
 127
127 -
 128
128 -
 129
129 -
 130
130 -
 131
131 -
 132
132 -
 133
133 -
 134
134 -
 135
135 -
136
-
137
-
138
-
139
-
140
-
141
-
142
-
143
-
144
-
145
-
146
-
147
-
148
-
149
-
150
-
151
-
152
-
153
-
154
-
155
-
156
-
157
-
158
-
159
-
160
-
161
-
162
-
163
-
164
-
165
-
166
-
167
-
168
-
169
-
170
-
171
-
172
-
173
-
174
-
175
-
176
-
177
-
178
-
179
-
180
-
181
-
182
-
183
-
184
-
185
-
186
-
187
-
188
-
189
-
190
-
191
-
192
-
193
-
194
-
195
-
196
-
197
-
198
-
199
-
200
-
201
-
202
-
203
-
204
-
205
-
206
-
207
-
208
-
209
-
210
-
211
-
212
-
213
-
214
-
215
-
216
-
217
-
218
-
219
-
220
-
221
-
222
-
223
-
224
-
225
-
226
-
227
-
228
-
229
-
230
-
231
-
232
-
233
-
234
-
235
-
236
-
237
-
238
-
239
-
240
-
241
-
242
-
243
-
244
-
245
-
246
-
247
-
248
-
249
-
250
-
251
-
252
-
253
-
254
-
255
-
256
 |
 |

Bank of America 2015 123
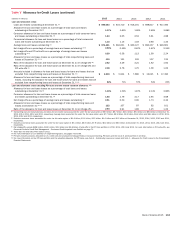
Table XV Quarterly Reconciliations to GAAP Financial Measures (1)
2015 Quarters 2014 Quarters
(Dollars in millions) Fourth Third Second First Fourth Third Second First
Reconciliation of net interest income to net interest income on a fully
taxable-equivalent basis
Net interest income $ 9,801 $ 9,511 $ 10,488 $ 9,451 $ 9,635 $ 10,219 $10,013 $10,085
Fully taxable-equivalent adjustment 231 231 228 219 230 225 213 201
Net interest income on a fully taxable-equivalent basis $ 10,032 $ 9,742 $ 10,716 $ 9,670 $ 9,865 $ 10,444 $10,226 $10,286
Reconciliation of total revenue, net of interest expense to total revenue,
net of interest expense on a fully taxable-equivalent basis
Total revenue, net of interest expense (2) $ 19,528 $ 20,381 $ 21,816 $ 20,782 $ 18,725 $ 21,209 $21,747 $22,566
Fully taxable-equivalent adjustment 231 231 228 219 230 225 213 201
Total revenue, net of interest expense on a fully taxable-equivalent
basis $ 19,759 $ 20,612 $ 22,044 $ 21,001 $ 18,955 $ 21,434 $21,960 $22,767
Reconciliation of income tax expense (benefit) to income tax expense
(benefit) on a fully taxable-equivalent basis
Income tax expense (benefit) (2) $ 1,511 $ 1,446 $ 2,084 $ 1,225 $ 1,260 $ 663 $504 $(405)
Fully taxable-equivalent adjustment 231 231 228 219 230 225 213 201
Income tax expense (benefit) on a fully taxable-equivalent basis $ 1,742 $ 1,677 $ 2,312 $ 1,444 $ 1,490 $ 888 $717 $(204)
Reconciliation of average common shareholders’ equity to average
tangible common shareholders’ equity
Common shareholders’ equity $ 234,851 $ 231,620 $ 228,780 $ 225,357 $ 224,479 $ 222,374 $ 222,221 $ 223,207
Goodwill (69,761) (69,774) (69,775) (69,776) (69,782) (69,792) (69,822) (69,842)
Intangible assets (excluding MSRs) (3,888) (4,099) (4,307) (4,518) (4,747) (4,992) (5,235) (5,474)
Related deferred tax liabilities 1,753 1,811 1,885 1,959 2,019 2,077 2,100 2,165
Tangible common shareholders’ equity $ 162,955 $ 159,558 $ 156,583 $ 153,022 $ 151,969 $ 149,667 $ 149,264 $ 150,056
Reconciliation of average shareholders’ equity to average tangible
shareholders’ equity
Shareholders’ equity $ 257,125 $ 253,893 $ 251,054 $ 245,744 $ 243,454 $ 238,040 $ 235,803 $ 236,559
Goodwill (69,761) (69,774) (69,775) (69,776) (69,782) (69,792) (69,822) (69,842)
Intangible assets (excluding MSRs) (3,888) (4,099) (4,307) (4,518) (4,747) (4,992) (5,235) (5,474)
Related deferred tax liabilities 1,753 1,811 1,885 1,959 2,019 2,077 2,100 2,165
Tangible shareholders’ equity $ 185,229 $ 181,831 $ 178,857 $ 173,409 $ 170,944 $ 165,333 $ 162,846 $ 163,408
Reconciliation of period-end common shareholders’ equity to period-end
tangible common shareholders’ equity
Common shareholders’ equity $ 233,932 $ 233,632 $ 229,386 $ 227,915 $ 224,162 $ 220,768 $ 222,565 $ 218,536
Goodwill (69,761) (69,761) (69,775) (69,776) (69,777) (69,784) (69,810) (69,842)
Intangible assets (excluding MSRs) (3,768) (3,973) (4,188) (4,391) (4,612) (4,849) (5,099) (5,337)
Related deferred tax liabilities 1,716 1,762 1,813 1,900 1,960 2,019 2,078 2,100
Tangible common shareholders’ equity $ 162,119 $ 161,660 $ 157,236 $ 155,648 $ 151,733 $ 148,154 $ 149,734 $ 145,457
Reconciliation of period-end shareholders’ equity to period-end tangible
shareholders’ equity
Shareholders’ equity $ 256,205 $ 255,905 $ 251,659 $ 250,188 $ 243,471 $ 238,681 $ 237,411 $ 231,888
Goodwill (69,761) (69,761) (69,775) (69,776) (69,777) (69,784) (69,810) (69,842)
Intangible assets (excluding MSRs) (3,768) (3,973) (4,188) (4,391) (4,612) (4,849) (5,099) (5,337)
Related deferred tax liabilities 1,716 1,762 1,813 1,900 1,960 2,019 2,078 2,100
Tangible shareholders’ equity $ 184,392 $ 183,933 $ 179,509 $ 177,921 $ 171,042 $ 166,067 $ 164,580 $ 158,809
Reconciliation of period-end assets to period-end tangible assets
Assets $ 2,144,316 $2,153,006 $2,149,034 $2,143,545 $2,104,534 $2,123,613 $2,170,557 $2,149,851
Goodwill (69,761) (69,761) (69,775) (69,776) (69,777) (69,784) (69,810) (69,842)
Intangible assets (excluding MSRs) (3,768) (3,973) (4,188) (4,391) (4,612) (4,849) (5,099) (5,337)
Related deferred tax liabilities 1,716 1,762 1,813 1,900 1,960 2,019 2,078 2,100
Tangible assets $ 2,072,503 $2,081,034 $2,076,884 $2,071,278 $2,032,105 $2,050,999 $2,097,726 $2,076,772
(1) Presents reconciliations of non-GAAP financial measures to GAAP financial measures. We believe the use of these non-GAAP financial measures provides additional clarity in assessing the results
of the Corporation. Other companies may define or calculate these measures differently. For more information on non-GAAP financial measures and ratios we use in assessing the results of the
Corporation, see Supplemental Financial Data on page 28.
(2) The results for 2015 were impacted by the early adoption of new accounting guidance on recognition and measurement of financial instruments. For additional information, see Executive Summary
– Recent Events on page 20.