Bank of America 2015 Annual Report Download - page 154
Download and view the complete annual report
Please find page 154 of the 2015 Bank of America annual report below. You can navigate through the pages in the report by either clicking on the pages listed below, or by using the keyword search tool below to find specific information within the annual report.-
 1
1 -
2
-
3
-
4
-
5
-
6
-
7
-
8
-
9
-
10
-
11
-
12
-
13
-
14
-
15
-
16
-
17
-
18
-
19
-
20
-
21
-
22
-
23
-
24
-
25
-
26
-
27
-
28
-
29
-
30
-
31
-
32
-
33
-
34
-
35
-
36
-
37
-
38
-
39
-
40
-
41
-
42
-
43
-
44
-
45
-
46
-
47
-
48
-
49
-
50
-
51
-
52
-
53
-
54
-
55
-
56
-
57
-
58
-
59
-
60
-
61
-
62
-
63
-
64
-
65
-
66
-
67
-
68
-
69
-
70
-
71
-
72
-
73
-
74
-
75
-
76
-
77
-
78
-
79
-
80
-
81
-
82
-
83
-
84
-
85
-
86
-
87
-
88
-
89
-
90
-
91
-
92
-
93
-
94
-
95
-
96
-
97
-
98
-
99
-
100
-
101
-
102
-
103
-
104
-
105
-
106
-
107
-
108
-
109
-
110
-
111
-
112
-
113
-
114
-
115
-
116
-
117
-
118
-
119
-
120
-
121
-
122
-
123
-
124
-
125
-
126
-
127
-
128
-
129
-
130
-
131
-
132
-
133
-
134
-
135
-
136
-
137
-
138
-
139
-
140
-
141
-
142
-
143
-
 144
144 -
 145
145 -
 146
146 -
 147
147 -
 148
148 -
 149
149 -
 150
150 -
 151
151 -
 152
152 -
 153
153 -
 154
154 -
 155
155 -
 156
156 -
 157
157 -
 158
158 -
 159
159 -
 160
160 -
 161
161 -
 162
162 -
 163
163 -
 164
164 -
165
-
166
-
167
-
168
-
169
-
170
-
171
-
172
-
173
-
174
-
175
-
176
-
177
-
178
-
179
-
180
-
181
-
182
-
183
-
184
-
185
-
186
-
187
-
188
-
189
-
190
-
191
-
192
-
193
-
194
-
195
-
196
-
197
-
198
-
199
-
200
-
201
-
202
-
203
-
204
-
205
-
206
-
207
-
208
-
209
-
210
-
211
-
212
-
213
-
214
-
215
-
216
-
217
-
218
-
219
-
220
-
221
-
222
-
223
-
224
-
225
-
226
-
227
-
228
-
229
-
230
-
231
-
232
-
233
-
234
-
235
-
236
-
237
-
238
-
239
-
240
-
241
-
242
-
243
-
244
-
245
-
246
-
247
-
248
-
249
-
250
-
251
-
252
-
253
-
254
-
255
-
256
 |
 |

152 Bank of America 2015
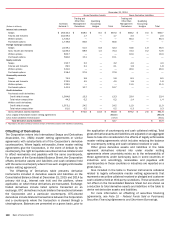
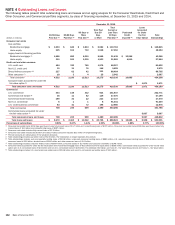
Other Risk Management Derivatives
Other risk management derivatives are used by the Corporation to reduce certain risk exposures. These derivatives are not qualifying
accounting hedges because either they did not qualify for or were not designated as accounting hedges. The table below presents
gains (losses) on these derivatives for 2015, 2014 and 2013. These gains (losses) are largely offset by the income or expense that
is recorded on the hedged item.
Other Risk Management Derivatives
Gains (Losses)
(Dollars in millions) 2015 2014 2013
Interest rate risk on mortgage banking income (1) $254 $ 1,017 $ (619)
Credit risk on loans (2) (22) 16 (47)
Interest rate and foreign currency risk on ALM activities (3) (222)(3,683) 2,501
Price risk on restricted stock awards (4) (267)600 865
Other 11 (9) (19)
(1) Net gains (losses) on these derivatives are recorded in mortgage banking income as they are used to mitigate the interest rate risk related to MSRs, IRLCs and mortgage loans held-for-sale, all of
which are measured at fair value with changes in fair value recorded in mortgage banking income. The net gains on IRLCs related to the origination of mortgage loans that are held-for-sale, which
are not included in the table but are considered derivative instruments, were $714 million, $776 million and $927 million for 2015, 2014 and 2013, respectively.
(2) Primarily related to derivatives that are economic hedges of credit risk on loans. Net gains (losses) on these derivatives are recorded in other income.
(3) Primarily related to hedges of debt securities carried at fair value and hedges of foreign currency-denominated debt. Gains (losses) on these derivatives and the related hedged items are recorded
in other income.
(4) Gains (losses) on these derivatives are recorded in personnel expense.
Transfers of Financial Assets with Risk Retained
through Derivatives
The Corporation enters into certain transactions involving the
transfer of financial assets that are accounted for as sales where
substantially all of the economic exposure to the transferred
financial assets is retained by the Corporation through a derivative
agreement with the initial transferee. These transactions are
accounted for as sales because the Corporation does not retain
control over the assets transferred.
Through December 31, 2015, the Corporation transferred $7.9
billion of primarily non-U.S. government-guaranteed mortgage-
backed securities (MBS) to a third-party trust. The Corporation
received gross cash proceeds of $7.9 billion at the transfer dates.
At December 31, 2015, the fair value of these securities was $7.2
billion. The Corporation simultaneously entered into derivatives
with those counterparties whereby the Corporation retained
certain economic exposures to those securities (e.g., interest rate
and/or credit risk). A derivative asset of $24 million and a liability
of $29 million were recorded at December 31, 2015 and are
included in credit derivatives in the derivative instruments table
on page 147. The economic exposure retained by the Corporation
is typically hedged with interest rate swaps and interest rate
swaptions.
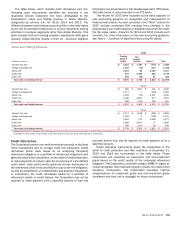
Sales and Trading Revenue
The Corporation enters into trading derivatives to facilitate client
transactions and to manage risk exposures arising from trading
account assets and liabilities. It is the Corporation’s policy to
include these derivative instruments in its trading activities which
include derivatives and non-derivative cash instruments. The
resulting risk from these derivatives is managed on a portfolio
basis as part of the Corporation’s Global Markets business
segment. The related sales and trading revenue generated within
Global Markets is recorded in various income statement line items
including trading account profits and net interest income as well
as other revenue categories.
Sales and trading revenue includes changes in the fair value
and realized gains and losses on the sales of trading and other
assets, net interest income, and fees primarily from commissions
on equity securities. Revenue is generated by the difference in the
client price for an instrument and the price at which the trading
desk can execute the trade in the dealer market. For equity
securities, commissions related to purchases and sales are
recorded in the “Other” column in the Sales and Trading Revenue
table. Changes in the fair value of these securities are included
in trading account profits. For debt securities, revenue, with the
exception of interest associated with the debt securities, is
typically included in trading account profits. Unlike commissions
for equity securities, the initial revenue related to broker-dealer
services for debt securities is typically included in the pricing of
the instrument rather than being charged through separate fee
arrangements. Therefore, this revenue is recorded in trading
account profits as part of the initial mark to fair value. For
derivatives, the majority of revenue is included in trading account
profits. In transactions where the Corporation acts as agent, which
include exchange-traded futures and options, fees are recorded in
other income.