Bank of America 2015 Annual Report Download - page 119
Download and view the complete annual report
Please find page 119 of the 2015 Bank of America annual report below. You can navigate through the pages in the report by either clicking on the pages listed below, or by using the keyword search tool below to find specific information within the annual report.-
 1
1 -
2
-
3
-
4
-
5
-
6
-
7
-
8
-
9
-
10
-
11
-
12
-
13
-
14
-
15
-
16
-
17
-
18
-
19
-
20
-
21
-
22
-
23
-
24
-
25
-
26
-
27
-
28
-
29
-
30
-
31
-
32
-
33
-
34
-
35
-
36
-
37
-
38
-
39
-
40
-
41
-
42
-
43
-
44
-
45
-
46
-
47
-
48
-
49
-
50
-
51
-
52
-
53
-
54
-
55
-
56
-
57
-
58
-
59
-
60
-
61
-
62
-
63
-
64
-
65
-
66
-
67
-
68
-
69
-
70
-
71
-
72
-
73
-
74
-
75
-
76
-
77
-
78
-
79
-
80
-
81
-
82
-
83
-
84
-
85
-
86
-
87
-
88
-
89
-
90
-
91
-
92
-
93
-
94
-
95
-
96
-
97
-
98
-
99
-
100
-
101
-
102
-
103
-
104
-
105
-
106
-
107
-
108
-
 109
109 -
 110
110 -
 111
111 -
 112
112 -
 113
113 -
 114
114 -
 115
115 -
 116
116 -
 117
117 -
 118
118 -
 119
119 -
 120
120 -
 121
121 -
 122
122 -
 123
123 -
 124
124 -
 125
125 -
 126
126 -
 127
127 -
 128
128 -
 129
129 -
130
-
131
-
132
-
133
-
134
-
135
-
136
-
137
-
138
-
139
-
140
-
141
-
142
-
143
-
144
-
145
-
146
-
147
-
148
-
149
-
150
-
151
-
152
-
153
-
154
-
155
-
156
-
157
-
158
-
159
-
160
-
161
-
162
-
163
-
164
-
165
-
166
-
167
-
168
-
169
-
170
-
171
-
172
-
173
-
174
-
175
-
176
-
177
-
178
-
179
-
180
-
181
-
182
-
183
-
184
-
185
-
186
-
187
-
188
-
189
-
190
-
191
-
192
-
193
-
194
-
195
-
196
-
197
-
198
-
199
-
200
-
201
-
202
-
203
-
204
-
205
-
206
-
207
-
208
-
209
-
210
-
211
-
212
-
213
-
214
-
215
-
216
-
217
-
218
-
219
-
220
-
221
-
222
-
223
-
224
-
225
-
226
-
227
-
228
-
229
-
230
-
231
-
232
-
233
-
234
-
235
-
236
-
237
-
238
-
239
-
240
-
241
-
242
-
243
-
244
-
245
-
246
-
247
-
248
-
249
-
250
-
251
-
252
-
253
-
254
-
255
-
256
 |
 |

Bank of America 2015 117
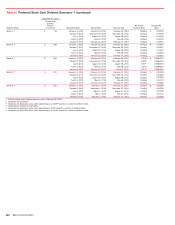
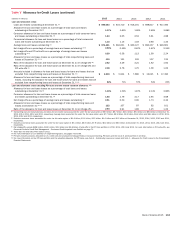
Table X Selected Quarterly Financial Data (continued)
2015 Quarters (1) 2014 Quarters
(Dollars in millions) Fourth Third Second First Fourth Third Second First
Average balance sheet
Total loans and leases $ 891,861 $ 882,841 $ 881,415 $ 872,393 $ 884,733 $ 899,241 $ 912,580 $ 919,482
Total assets 2,180,472 2,168,993 2,151,966 2,138,574 2,137,551 2,136,109 2,169,555 2,139,266
Total deposits 1,186,051 1,159,231 1,146,789 1,130,726 1,122,514 1,127,488 1,128,563 1,118,178
Long-term debt 237,384 240,520 242,230 240,127 249,221 251,772 259,825 253,678
Common shareholders’ equity 234,851 231,620 228,780 225,357 224,479 222,374 222,221 223,207
Total shareholders’ equity 257,125 253,893 251,054 245,744 243,454 238,040 235,803 236,559
Asset quality (5)
Allowance for credit losses (6) $ 12,880 $ 13,318 $ 13,656 $ 14,213 $ 14,947 $ 15,635 $ 16,314 $ 17,127
Nonperforming loans, leases and foreclosed properties (7) 9,836 10,336 11,565 12,101 12,629 14,232 15,300 17,732
Allowance for loan and lease losses as a percentage of total loans
and leases outstanding (7) 1.37% 1.44% 1.49% 1.57% 1.65% 1.71% 1.75% 1.84%
Allowance for loan and lease losses as a percentage of total
nonperforming loans and leases (7) 130 129 122 122 121 112 108 97
Allowance for loan and lease losses as a percentage of total
nonperforming loans and leases, excluding the PCI loan portfolio (7) 122 120 111 110 107 100 95 85
Amounts included in allowance for loan and lease losses for loans and
leases that are excluded from nonperforming loans and leases (8) $ 4,518 $ 4,682 $ 5,050 $ 5,492 $ 5,944 $ 6,013 $ 6,488 $ 7,143
Allowance for loan and lease losses as a percentage of total
nonperforming loans and leases, excluding the allowance for loan
and lease losses for loans and leases that are excluded from
nonperforming loans and leases (7, 8) 82% 81% 75% 73% 71% 67% 64% 55%
Net charge-offs (9) $ 1,144 $ 932 $ 1,068 $ 1,194 $ 879 $ 1,043 $ 1,073 $ 1,388
Annualized net charge-offs as a percentage of average loans and
leases outstanding (7, 9) 0.51% 0.42% 0.49% 0.56% 0.40% 0.46% 0.48% 0.62%
Annualized net charge-offs as a percentage of average loans and
leases outstanding, excluding the PCI loan portfolio (7) 0.52 0.43 0.50 0.57 0.41 0.48 0.49 0.64
Annualized net charge-offs and PCI write-offs as a percentage of
average loans and leases outstanding (7) 0.55 0.49 0.62 0.70 0.40 0.57 0.55 0.79
Nonperforming loans and leases as a percentage of total loans and
leases outstanding (7) 1.05 1.11 1.22 1.29 1.37 1.53 1.63 1.89
Nonperforming loans, leases and foreclosed properties as a
percentage of total loans, leases and foreclosed properties (7) 1.10 1.17 1.31 1.39 1.45 1.61 1.70 1.96
Ratio of the allowance for loan and lease losses at period end to
annualized net charge-offs (9) 2.70 3.42 3.05 2.82 4.14 3.65 3.67 2.95
Ratio of the allowance for loan and lease losses at period end to
annualized net charge-offs, excluding the PCI loan portfolio 2.52 3.18 2.79 2.55 3.66 3.27 3.25 2.58
Ratio of the allowance for loan and lease losses at period end to
annualized net charge-offs and PCI write-offs 2.52 2.95 2.40 2.28 4.08 2.95 3.20 2.30
Capital ratios at period end (10)
Risk-based capital:
Common equity tier 1 capital 10.2% 11.6% 11.2% 11.1% 12.3% 12.0% 12.0% 11.8%
Tier 1 capital 11.3 12.9 12.5 12.3 13.4 12.8 12.5 11.9
Total capital 13.2 15.8 15.5 15.3 16.5 15.8 15.3 14.8
Tier 1 leverage 8.6 8.5 8.5 8.4 8.2 7.9 7.7 7.4
Tangible equity (4) 8.9 8.8 8.6 8.6 8.4 8.1 7.8 7.6
Tangible common equity (4) 7.8 7.8 7.6 7.5 7.5 7.2 7.1 7.0
For footnotes see page 116.