Bank of America 2015 Annual Report Download - page 218
Download and view the complete annual report
Please find page 218 of the 2015 Bank of America annual report below. You can navigate through the pages in the report by either clicking on the pages listed below, or by using the keyword search tool below to find specific information within the annual report.-
 1
1 -
2
-
3
-
4
-
5
-
6
-
7
-
8
-
9
-
10
-
11
-
12
-
13
-
14
-
15
-
16
-
17
-
18
-
19
-
20
-
21
-
22
-
23
-
24
-
25
-
26
-
27
-
28
-
29
-
30
-
31
-
32
-
33
-
34
-
35
-
36
-
37
-
38
-
39
-
40
-
41
-
42
-
43
-
44
-
45
-
46
-
47
-
48
-
49
-
50
-
51
-
52
-
53
-
54
-
55
-
56
-
57
-
58
-
59
-
60
-
61
-
62
-
63
-
64
-
65
-
66
-
67
-
68
-
69
-
70
-
71
-
72
-
73
-
74
-
75
-
76
-
77
-
78
-
79
-
80
-
81
-
82
-
83
-
84
-
85
-
86
-
87
-
88
-
89
-
90
-
91
-
92
-
93
-
94
-
95
-
96
-
97
-
98
-
99
-
100
-
101
-
102
-
103
-
104
-
105
-
106
-
107
-
108
-
109
-
110
-
111
-
112
-
113
-
114
-
115
-
116
-
117
-
118
-
119
-
120
-
121
-
122
-
123
-
124
-
125
-
126
-
127
-
128
-
129
-
130
-
131
-
132
-
133
-
134
-
135
-
136
-
137
-
138
-
139
-
140
-
141
-
142
-
143
-
144
-
145
-
146
-
147
-
148
-
149
-
150
-
151
-
152
-
153
-
154
-
155
-
156
-
157
-
158
-
159
-
160
-
161
-
162
-
163
-
164
-
165
-
166
-
167
-
168
-
169
-
170
-
171
-
172
-
173
-
174
-
175
-
176
-
177
-
178
-
179
-
180
-
181
-
182
-
183
-
184
-
185
-
186
-
187
-
188
-
189
-
190
-
191
-
192
-
193
-
194
-
195
-
196
-
197
-
198
-
199
-
200
-
201
-
202
-
203
-
204
-
205
-
206
-
207
-
 208
208 -
 209
209 -
 210
210 -
 211
211 -
 212
212 -
 213
213 -
 214
214 -
 215
215 -
 216
216 -
 217
217 -
 218
218 -
 219
219 -
 220
220 -
 221
221 -
 222
222 -
 223
223 -
 224
224 -
 225
225 -
 226
226 -
 227
227 -
 228
228 -
229
-
230
-
231
-
232
-
233
-
234
-
235
-
236
-
237
-
238
-
239
-
240
-
241
-
242
-
243
-
244
-
245
-
246
-
247
-
248
-
249
-
250
-
251
-
252
-
253
-
254
-
255
-
256
 |
 |

216 Bank of America 2015
on plan assets. With all other assumptions held constant, a 25
basis point (bp) decline in the discount rate and expected return
on plan asset assumptions would have resulted in an increase in
the net periodic benefit cost for the Qualified Pension Plan
recognized in 2015 of approximately $9 million and $44 million,
and to be recognized in 2016 of approximately $9 million and $43
million. For the Postretirement Health and Life Plans, a 25 bp
decline in the discount rate would have resulted in an increase in
the net periodic benefit cost recognized in 2015 of approximately
$9 million, and to be recognized in 2016 of approximately $8
million. For the Non-U.S. Pension Plans and the Nonqualified and
Other Pension Plans, a 25 bp decline in discount rates would not
have a significant impact on the net periodic benefit cost for 2015
and 2016.
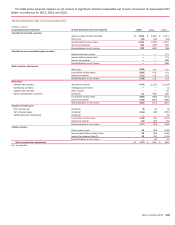
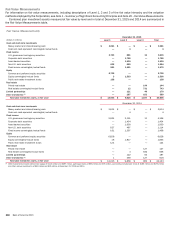
Pretax amounts included in accumulated OCI for employee
benefit plans at December 31, 2015 and 2014 are presented in
the table below.
Pretax Amounts Included in Accumulated OCI
Qualified
Pension Plan
Non-U.S.
Pension Plans
Nonqualified
and Other
Pension Plans
Postretirement
Health and
Life Plans Total
(Dollars in millions) 2015 2014 2015 2014 2015 2014 2015 2014 2015 2014
Net actuarial loss (gain) $ 3,920 $ 4,061 $137 $ 355 $848 $ 968 $ (150) $ (56) $ 4,755 $ 5,328
Prior service cost (credits) ——(10) (9)——16 20 611
Amounts recognized in accumulated OCI $ 3,920 $ 4,061 $127 $ 346 $848 $ 968 $ (134) $ (36) $ 4,761 $ 5,339
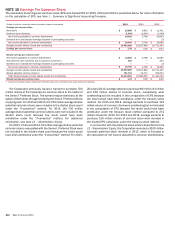
Pretax amounts recognized in OCI for employee benefit plans in 2015 included the following components.
Pretax Amounts Recognized in OCI
Qualified
Pension Plan
Non-U.S.
Pension Plans
Nonqualified
and Other
Pension Plans
Postretirement
Health and
Life Plans Total
(Dollars in millions) 2015 2014 2015 2014 2015 2014 2015 2014 2015 2014
Current year actuarial loss (gain) $ 29 $ 1,378 $ (211) $ 87 $ (86) $ 138 $ (140) $ 26 $(408)$ 1,629
Amortization of actuarial gain (loss) (170) (111) (6) (3)(34) (25) 46 89 (164)(50)
Current year prior service cost (credit) ——(1) 1————(1)1
Amortization of prior service cost ——(1) (1)——(4)(4)(5)(5)
Amounts recognized in OCI $ (141) $ 1,267 $ (219) $ 84 $ (120) $ 113 $ (98) $ 111 $(578)$ 1,575
The estimated pretax amounts that will be amortized from accumulated OCI into expense in 2016 are presented in the table below.
Estimated Pretax Amounts Amortized from Accumulated OCI into Period Cost in 2016
(Dollars in millions)
Qualified
Pension Plan
Non-U.S.
Pension Plans
Nonqualified
and Other
Pension Plans
Postretirement
Health and
Life Plans Total
Net actuarial loss (gain) $ 136 $ 6$ 25 $ (67) $ 100
Prior service cost — 1 — 4 5
Total amounts amortized from accumulated OCI $ 136 $ 7$ 25 $ (63) $ 105
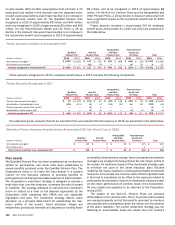
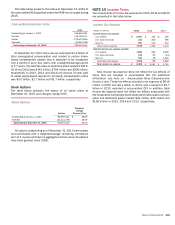
Plan Assets
The Qualified Pension Plan has been established as a retirement
vehicle for participants, and trusts have been established to
secure benefits promised under the Qualified Pension Plan. The
Corporation’s policy is to invest the trust assets in a prudent
manner for the exclusive purpose of providing benefits to
participants and defraying reasonable expenses of administration.
The Corporation’s investment strategy is designed to provide a
total return that, over the long term, increases the ratio of assets
to liabilities. The strategy attempts to maximize the investment
return on assets at a level of risk deemed appropriate by the
Corporation while complying with ERISA and any applicable
regulations and laws. The investment strategy utilizes asset
allocation as a principal determinant for establishing the risk/
return profile of the assets. Asset allocation ranges are
established, periodically reviewed and adjusted as funding levels
and liability characteristics change. Active and passive investment
managers are employed to help enhance the risk/return profile of
the assets. An additional aspect of the investment strategy used
to minimize risk (part of the asset allocation plan) includes
matching the equity exposure of participant-selected investment
measures. For example, the common stock of the Corporation held
in the trust is maintained as an offset to the exposure related to
participants who elected to receive an investment measure based
on the return performance of common stock of the Corporation.
No plan assets are expected to be returned to the Corporation
during 2016.
The assets of the Non-U.S. Pension Plans are primarily
attributable to a U.K. pension plan. This U.K. pension plan’s assets
are invested prudently so that the benefits promised to members
are provided with consideration given the nature and the duration
of the plan’s liabilities. The current investment strategy was set
following an asset-liability study and advice from the trustee’s