Bank of America 2015 Annual Report Download - page 43
Download and view the complete annual report
Please find page 43 of the 2015 Bank of America annual report below. You can navigate through the pages in the report by either clicking on the pages listed below, or by using the keyword search tool below to find specific information within the annual report.-
 1
1 -
2
-
3
-
4
-
5
-
6
-
7
-
8
-
9
-
10
-
11
-
12
-
13
-
14
-
15
-
16
-
17
-
18
-
19
-
20
-
21
-
22
-
23
-
24
-
25
-
26
-
27
-
28
-
29
-
30
-
31
-
32
-
 33
33 -
 34
34 -
 35
35 -
 36
36 -
 37
37 -
 38
38 -
 39
39 -
 40
40 -
 41
41 -
 42
42 -
 43
43 -
 44
44 -
 45
45 -
 46
46 -
 47
47 -
 48
48 -
 49
49 -
 50
50 -
 51
51 -
 52
52 -
 53
53 -
54
-
55
-
56
-
57
-
58
-
59
-
60
-
61
-
62
-
63
-
64
-
65
-
66
-
67
-
68
-
69
-
70
-
71
-
72
-
73
-
74
-
75
-
76
-
77
-
78
-
79
-
80
-
81
-
82
-
83
-
84
-
85
-
86
-
87
-
88
-
89
-
90
-
91
-
92
-
93
-
94
-
95
-
96
-
97
-
98
-
99
-
100
-
101
-
102
-
103
-
104
-
105
-
106
-
107
-
108
-
109
-
110
-
111
-
112
-
113
-
114
-
115
-
116
-
117
-
118
-
119
-
120
-
121
-
122
-
123
-
124
-
125
-
126
-
127
-
128
-
129
-
130
-
131
-
132
-
133
-
134
-
135
-
136
-
137
-
138
-
139
-
140
-
141
-
142
-
143
-
144
-
145
-
146
-
147
-
148
-
149
-
150
-
151
-
152
-
153
-
154
-
155
-
156
-
157
-
158
-
159
-
160
-
161
-
162
-
163
-
164
-
165
-
166
-
167
-
168
-
169
-
170
-
171
-
172
-
173
-
174
-
175
-
176
-
177
-
178
-
179
-
180
-
181
-
182
-
183
-
184
-
185
-
186
-
187
-
188
-
189
-
190
-
191
-
192
-
193
-
194
-
195
-
196
-
197
-
198
-
199
-
200
-
201
-
202
-
203
-
204
-
205
-
206
-
207
-
208
-
209
-
210
-
211
-
212
-
213
-
214
-
215
-
216
-
217
-
218
-
219
-
220
-
221
-
222
-
223
-
224
-
225
-
226
-
227
-
228
-
229
-
230
-
231
-
232
-
233
-
234
-
235
-
236
-
237
-
238
-
239
-
240
-
241
-
242
-
243
-
244
-
245
-
246
-
247
-
248
-
249
-
250
-
251
-
252
-
253
-
254
-
255
-
256
 |
 |

Bank of America 2015 41
Legacy Portfolios
The Legacy Portfolios (both owned and serviced) include those
loans originated prior to January 1, 2011 that would not have been
originated under our established underwriting standards in place
as of December 31, 2010. The purchased credit-impaired (PCI)
loan portfolio, as well as certain loans that met a pre-defined
delinquency status or probability of default threshold as of January
1, 2011, are also included in the Legacy Portfolios. Since
determining the pool of loans to be included in the Legacy Portfolios
as of January 1, 2011, the criteria have not changed for these
portfolios, but will continue to be evaluated over time.
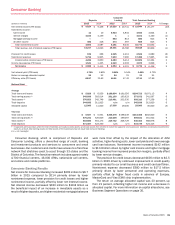
Legacy Owned Portfolio
The Legacy Owned Portfolio includes those loans that met the
criteria as described above and are on the balance sheet of the
Corporation. Home equity loans in this portfolio are held on the
balance sheet of LAS, and residential mortgage loans in this
portfolio are included as part of All Other. The financial results of
the on-balance sheet loans are reported in the segment that owns
the loans or in All Other. Total loans in the Legacy Owned Portfolio
decreased $18.3 billion in 2015 to $71.6 billion at December 31,
2015, of which $26.5 billion was held on the LAS balance sheet
and the remainder was included in All Other. The decrease was
largely due to payoffs and paydowns, as well as loan sales.
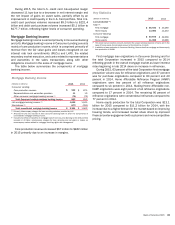
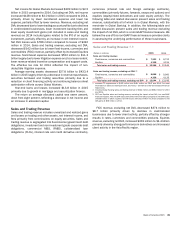
Legacy Serviced Portfolio
The Legacy Serviced Portfolio includes loans serviced by LAS in
both the Legacy Owned Portfolio and those loans serviced for
outside investors that met the criteria as described above. The
table below summarizes the balances of the residential mortgage
loans included in the Legacy Serviced Portfolio (the Legacy
Residential Mortgage Serviced Portfolio) representing 24 percent,
24 percent and 28 percent of the total residential mortgage
serviced portfolio of $491 billion, $609 billion and $719 billion,
as measured by unpaid principal balance, at December 31, 2015,
2014 and 2013, respectively. The decline in the Legacy Residential
Mortgage Serviced Portfolio was due to paydowns and payoffs,
and MSR and loan sales.
Legacy Residential Mortgage Serviced Portfolio, a subset
of the Residential Mortgage Serviced Portfolio (1)
December 31
(Dollars in billions) 2015 2014 2013
Unpaid principal balance
Residential mortgage loans
Total $ 116 $ 148 $ 203
60 days or more past due 13 25 49
Number of loans serviced (in thousands)
Residential mortgage loans
Total 632 794 1,083
60 days or more past due 72 135 258
(1) Excludes $28 billion, $34 billion and $39 billion of home equity loans and HELOCs at
December 31, 2015, 2014 and 2013, respectively.
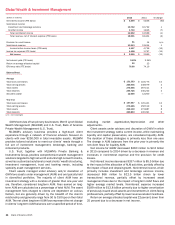
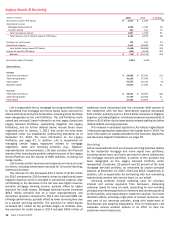
Non-Legacy Portfolio
As previously discussed, LAS is responsible for all of our servicing
activities. The table below summarizes the balances of the
residential mortgage loans that are not included in the Legacy
Serviced Portfolio (the Non-Legacy Residential Mortgage Serviced
Portfolio) representing 76 percent, 76 percent and 72 percent of
the total residential mortgage serviced portfolio, as measured by
unpaid principal balance, at December 31, 2015, 2014 and 2013,
respectively. The decline in the Non-Legacy Residential Mortgage
Serviced Portfolio was primarily due to paydowns and payoffs,
partially offset by new originations.
Non-Legacy Residential Mortgage Serviced Portfolio, a
subset of the Residential Mortgage Serviced Portfolio (1)
December 31
(Dollars in billions) 2015 2014 2013
Unpaid principal balance
Residential mortgage loans
Total $ 375 $ 461 $ 516
60 days or more past due 59 12
Number of loans serviced (in thousands)
Residential mortgage loans
Total 2,376 2,951 3,267
60 days or more past due 31 54 67
(1) Excludes $46 billion, $50 billion and $52 billion of home equity loans and HELOCs at
December 31, 2015, 2014 and 2013, respectively.