Bank of America 2015 Annual Report Download - page 81
Download and view the complete annual report
Please find page 81 of the 2015 Bank of America annual report below. You can navigate through the pages in the report by either clicking on the pages listed below, or by using the keyword search tool below to find specific information within the annual report.-
 1
1 -
2
-
3
-
4
-
5
-
6
-
7
-
8
-
9
-
10
-
11
-
12
-
13
-
14
-
15
-
16
-
17
-
18
-
19
-
20
-
21
-
22
-
23
-
24
-
25
-
26
-
27
-
28
-
29
-
30
-
31
-
32
-
33
-
34
-
35
-
36
-
37
-
38
-
39
-
40
-
41
-
42
-
43
-
44
-
45
-
46
-
47
-
48
-
49
-
50
-
51
-
52
-
53
-
54
-
55
-
56
-
57
-
58
-
59
-
60
-
61
-
62
-
63
-
64
-
65
-
66
-
67
-
68
-
69
-
70
-
 71
71 -
 72
72 -
 73
73 -
 74
74 -
 75
75 -
 76
76 -
 77
77 -
 78
78 -
 79
79 -
 80
80 -
 81
81 -
 82
82 -
 83
83 -
 84
84 -
 85
85 -
 86
86 -
 87
87 -
 88
88 -
 89
89 -
 90
90 -
 91
91 -
92
-
93
-
94
-
95
-
96
-
97
-
98
-
99
-
100
-
101
-
102
-
103
-
104
-
105
-
106
-
107
-
108
-
109
-
110
-
111
-
112
-
113
-
114
-
115
-
116
-
117
-
118
-
119
-
120
-
121
-
122
-
123
-
124
-
125
-
126
-
127
-
128
-
129
-
130
-
131
-
132
-
133
-
134
-
135
-
136
-
137
-
138
-
139
-
140
-
141
-
142
-
143
-
144
-
145
-
146
-
147
-
148
-
149
-
150
-
151
-
152
-
153
-
154
-
155
-
156
-
157
-
158
-
159
-
160
-
161
-
162
-
163
-
164
-
165
-
166
-
167
-
168
-
169
-
170
-
171
-
172
-
173
-
174
-
175
-
176
-
177
-
178
-
179
-
180
-
181
-
182
-
183
-
184
-
185
-
186
-
187
-
188
-
189
-
190
-
191
-
192
-
193
-
194
-
195
-
196
-
197
-
198
-
199
-
200
-
201
-
202
-
203
-
204
-
205
-
206
-
207
-
208
-
209
-
210
-
211
-
212
-
213
-
214
-
215
-
216
-
217
-
218
-
219
-
220
-
221
-
222
-
223
-
224
-
225
-
226
-
227
-
228
-
229
-
230
-
231
-
232
-
233
-
234
-
235
-
236
-
237
-
238
-
239
-
240
-
241
-
242
-
243
-
244
-
245
-
246
-
247
-
248
-
249
-
250
-
251
-
252
-
253
-
254
-
255
-
256
 |
 |

Bank of America 2015 79
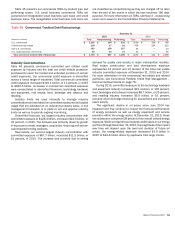
Tables 42 and 43 present commercial real estate credit quality
data by non-residential and residential property types. The
residential portfolio presented in Tables 41, 42 and 43 includes
condominiums and other residential real estate. Other property
types in Tables 41, 42 and 43 primarily include special purpose,
nursing/retirement homes, medical facilities and restaurants.
Table 42 Commercial Real Estate Credit Quality Data
December 31
Nonperforming Loans and
Foreclosed Properties (1)
Utilized Reservable
Criticized Exposure (2)
(Dollars in millions) 2015 2014 2015 2014
Non-residential
Office $ 14 $ 177 $110 $ 235
Multi-family rental 18 21 69 125
Shopping centers/retail 12 46 183 350
Industrial/warehouse 642 16 67
Hotels/motels 18 316 26
Multi-use 15 11 42 55
Unsecured 11414
Land and land development 251 363
Other 814 59 145
Total non-residential 94 366 502 1,080
Residential 14 22 11 28
Total commercial real estate $ 108 $ 388 $513 $ 1,108
(1) Includes commercial foreclosed properties of $15 million and $67 million at December 31, 2015 and 2014.
(2) Includes loans, SBLCs and bankers’ acceptances and excludes loans accounted for under the fair value option.
Table 43 Commercial Real Estate Net Charge-offs and Related Ratios
Net Charge-offs Net Charge-off Ratios (1)
(Dollars in millions) 2015 2014 2015 2014
Non-residential
Office $3
$(4)0.02%(0.04)%
Multi-family rental 1(22) 0.01 (0.25)
Shopping centers/retail 140.01 0.06
Industrial/warehouse (1) (1)(0.02) (0.03)
Hotels/motels 5(3)0.12 (0.07)
Multi-use (4) (9)(0.19) (0.49)
Unsecured (4) (22) (0.20) (1.37)
Land and land development (9) (2)(1.60) (0.31)
Other 1(16) 0.01 (0.37)
Total non-residential (7) (75) (0.01) (0.16)
Residential 2 (8)0.08 (0.47)
Total commercial real estate $ (5) $ (83) (0.01) (0.18)
(1) Net charge-off ratios are calculated as net charge-offs divided by average outstanding loans excluding loans accounted for under the fair value option.
At December 31, 2015, total committed non-residential
exposure was $81.0 billion compared to $67.7 billion at
December 31, 2014, of which $55.1 billion and $46.0 billion were
funded loans. Non-residential nonperforming loans and foreclosed
properties declined $272 million, or 74 percent, to $94 million
during 2015 primarily due to a decrease in office property. The
non-residential nonperforming loans and foreclosed properties
represented 0.17 percent and 0.79 percent of total non-residential
loans and foreclosed properties at December 31, 2015 and 2014.
Non-residential utilized reservable criticized exposure decreased
$578 million, or 54 percent, to $502 million at December 31,
2015 compared to $1.1 billion at December 31, 2014, which
represented 0.89 percent and 2.27 percent of non-residential
utilized reservable exposure. For the non-residential portfolio, net
recoveries decreased $68 million to $7 million in 2015 compared
to 2014.
At December 31, 2015, total committed residential exposure
was $4.1 billion compared to $3.6 billion at December 31, 2014,
of which $2.1 billion and $1.7 billion were funded secured loans.
Residential nonperforming loans and foreclosed properties
decreased $8 million, or 36 percent, and residential utilized
reservable criticized exposure decreased $17 million, or 61
percent, during 2015. The nonperforming loans, leases and
foreclosed properties and the utilized reservable criticized ratios
for the residential portfolio were 0.66 percent and 0.52 percent
at December 31, 2015 compared to 1.28 percent and 1.51
percent at December 31, 2014.
At December 31, 2015 and 2014, the commercial real estate
loan portfolio included $7.6 billion and $6.7 billion of funded
construction and land development loans that were originated to
fund the construction and/or rehabilitation of commercial
properties. Reservable criticized construction and land
development loans totaled $108 million and $164 million, and
nonperforming construction and land development loans and
foreclosed properties totaled $44 million and $80 million at
December 31, 2015 and 2014. During a property’s construction