Bank of America 2015 Annual Report Download - page 45
Download and view the complete annual report
Please find page 45 of the 2015 Bank of America annual report below. You can navigate through the pages in the report by either clicking on the pages listed below, or by using the keyword search tool below to find specific information within the annual report.-
 1
1 -
2
-
3
-
4
-
5
-
6
-
7
-
8
-
9
-
10
-
11
-
12
-
13
-
14
-
15
-
16
-
17
-
18
-
19
-
20
-
21
-
22
-
23
-
24
-
25
-
26
-
27
-
28
-
29
-
30
-
31
-
32
-
33
-
34
-
 35
35 -
 36
36 -
 37
37 -
 38
38 -
 39
39 -
 40
40 -
 41
41 -
 42
42 -
 43
43 -
 44
44 -
 45
45 -
 46
46 -
 47
47 -
 48
48 -
 49
49 -
 50
50 -
 51
51 -
 52
52 -
 53
53 -
 54
54 -
 55
55 -
56
-
57
-
58
-
59
-
60
-
61
-
62
-
63
-
64
-
65
-
66
-
67
-
68
-
69
-
70
-
71
-
72
-
73
-
74
-
75
-
76
-
77
-
78
-
79
-
80
-
81
-
82
-
83
-
84
-
85
-
86
-
87
-
88
-
89
-
90
-
91
-
92
-
93
-
94
-
95
-
96
-
97
-
98
-
99
-
100
-
101
-
102
-
103
-
104
-
105
-
106
-
107
-
108
-
109
-
110
-
111
-
112
-
113
-
114
-
115
-
116
-
117
-
118
-
119
-
120
-
121
-
122
-
123
-
124
-
125
-
126
-
127
-
128
-
129
-
130
-
131
-
132
-
133
-
134
-
135
-
136
-
137
-
138
-
139
-
140
-
141
-
142
-
143
-
144
-
145
-
146
-
147
-
148
-
149
-
150
-
151
-
152
-
153
-
154
-
155
-
156
-
157
-
158
-
159
-
160
-
161
-
162
-
163
-
164
-
165
-
166
-
167
-
168
-
169
-
170
-
171
-
172
-
173
-
174
-
175
-
176
-
177
-
178
-
179
-
180
-
181
-
182
-
183
-
184
-
185
-
186
-
187
-
188
-
189
-
190
-
191
-
192
-
193
-
194
-
195
-
196
-
197
-
198
-
199
-
200
-
201
-
202
-
203
-
204
-
205
-
206
-
207
-
208
-
209
-
210
-
211
-
212
-
213
-
214
-
215
-
216
-
217
-
218
-
219
-
220
-
221
-
222
-
223
-
224
-
225
-
226
-
227
-
228
-
229
-
230
-
231
-
232
-
233
-
234
-
235
-
236
-
237
-
238
-
239
-
240
-
241
-
242
-
243
-
244
-
245
-
246
-
247
-
248
-
249
-
250
-
251
-
252
-
253
-
254
-
255
-
256
 |
 |

Bank of America 2015 43
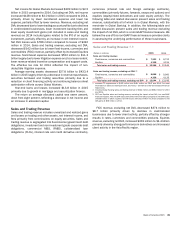
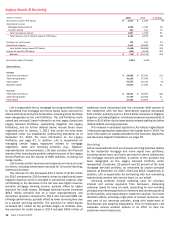
All Other
(Dollars in millions) 2015 2014 % Change
Net interest income (FTE basis) $ (348) $ (526) (34)%
Noninterest income:
Card income 263 356 (26)
Equity investment income —727 (100)
Gains on sales of debt securities 1,079 1,310 (18)
All other loss (1,613)(2,435) (34)
Total noninterest income (271) (42) n/m
Total revenue, net of interest expense (FTE basis) (619) (568) 9
Provision for credit losses (342) (978) (65)
Noninterest expense 2,215 2,933 (24)
Loss before income taxes (FTE basis) (2,492)(2,523) (1)
Income tax benefit (FTE basis) (2,003)(2,587) (23)
Net income (loss) $ (489) $ 64 n/m
Balance Sheet
Average
Loans and leases:
Residential mortgage $ 130,893 $180,249 (27)
Non-U.S. credit card 10,104 11,511 (12)
Other 6,403 10,753 (40)
Total loans and leases 147,400 202,513 (27)
Total assets (1) 257,893 278,812 (8)
Total deposits 21,862 30,834 (29)
Year end
Loans and leases:
Residential mortgage $ 109,030 $155,595 (30)
Non-U.S. credit card 9,975 10,465 (5)
Other 6,338 6,552 (3)
Total loans and leases 125,343 172,612 (27)
Total equity investments 4,297 4,871 (12)
Total assets (1) 230,791 261,581 (12)
Total deposits 22,898 19,240 19
(1) In segments where the total of liabilities and equity exceeds assets, which are generally deposit-taking segments, we allocate assets from All Other to those segments to match liabilities (i.e.,
deposits) and allocated shareholders’ equity. Such allocated assets were $499.4 billion and $480.3 billion for 2015 and 2014, and $518.8 billion and $474.6 billion at December 31, 2015 and
2014.
n/m = not meaningful
All Other consists of ALM activities, equity investments, the
international consumer card business, liquidating businesses,
residual expense allocations and other. ALM activities encompass
certain residential mortgages, debt securities, interest rate and
foreign currency risk management activities including the residual
net interest income allocation, the impact of certain allocation
methodologies and accounting hedge ineffectiveness. The results
of certain ALM activities are allocated to our business segments.
Beginning with new originations in 2014, we retain certain
residential mortgages in Consumer Banking, consistent with where
the overall relationship is managed; previously such mortgages
were in All Other. Additionally, certain residential mortgage loans
that are managed by LAS are held in All Other. For more information
on our ALM activities, see Interest Rate Risk Management for Non-
trading Activities on page 95 and Note 24 – Business Segment
Information to the Consolidated Financial Statements. Equity
investments include our merchant services joint venture as well
as Global Principal Investments (GPI) which is comprised of a
portfolio of equity, real estate and other alternative investments.
For more information on our merchant services joint venture, see
Note 12 – Commitments and Contingencies to the Consolidated
Financial Statements.
Net income for All Other decreased $553 million to a loss of
$489 million in 2015 primarily due to a decrease in equity
investment income, a decrease in the benefit in the provision for
credit losses and lower gains on sales of debt securities, partially
offset by higher net interest income, an increase in gains on sales
of consumer real estate loans, lower U.K. PPI costs and a decrease
in noninterest expense.
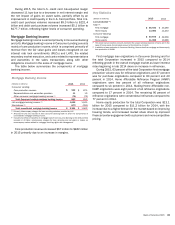
Net interest income increased $178 million primarily driven by
a lower impact from negative market-related adjustments on debt
securities, partially offset by a $612 million charge in 2015 related
to the discount on certain trust preferred securities. Negative
market-related adjustments on debt securities were $296 million
compared to $1.1 billion in 2014. Equity investment income
decreased $727 million as the prior year included a gain on the
sale of a portion of an equity investment. Gains on the sales of
loans, including nonperforming and other delinquent loans, net of
hedges, were $1.0 billion compared to gains of $672 million in
2014. Also included in all other loss were U.K. PPI costs of $319
million compared to $621 million, and negative FTE adjustments
of $1.6 billion compared to $1.3 billion to eliminate the FTE
treatment of certain tax credits recorded in Global Banking.