Bank of America 2015 Annual Report Download - page 167
Download and view the complete annual report
Please find page 167 of the 2015 Bank of America annual report below. You can navigate through the pages in the report by either clicking on the pages listed below, or by using the keyword search tool below to find specific information within the annual report.-
 1
1 -
2
-
3
-
4
-
5
-
6
-
7
-
8
-
9
-
10
-
11
-
12
-
13
-
14
-
15
-
16
-
17
-
18
-
19
-
20
-
21
-
22
-
23
-
24
-
25
-
26
-
27
-
28
-
29
-
30
-
31
-
32
-
33
-
34
-
35
-
36
-
37
-
38
-
39
-
40
-
41
-
42
-
43
-
44
-
45
-
46
-
47
-
48
-
49
-
50
-
51
-
52
-
53
-
54
-
55
-
56
-
57
-
58
-
59
-
60
-
61
-
62
-
63
-
64
-
65
-
66
-
67
-
68
-
69
-
70
-
71
-
72
-
73
-
74
-
75
-
76
-
77
-
78
-
79
-
80
-
81
-
82
-
83
-
84
-
85
-
86
-
87
-
88
-
89
-
90
-
91
-
92
-
93
-
94
-
95
-
96
-
97
-
98
-
99
-
100
-
101
-
102
-
103
-
104
-
105
-
106
-
107
-
108
-
109
-
110
-
111
-
112
-
113
-
114
-
115
-
116
-
117
-
118
-
119
-
120
-
121
-
122
-
123
-
124
-
125
-
126
-
127
-
128
-
129
-
130
-
131
-
132
-
133
-
134
-
135
-
136
-
137
-
138
-
139
-
140
-
141
-
142
-
143
-
144
-
145
-
146
-
147
-
148
-
149
-
150
-
151
-
152
-
153
-
154
-
155
-
156
-
 157
157 -
 158
158 -
 159
159 -
 160
160 -
 161
161 -
 162
162 -
 163
163 -
 164
164 -
 165
165 -
 166
166 -
 167
167 -
 168
168 -
 169
169 -
 170
170 -
 171
171 -
 172
172 -
 173
173 -
 174
174 -
 175
175 -
 176
176 -
 177
177 -
178
-
179
-
180
-
181
-
182
-
183
-
184
-
185
-
186
-
187
-
188
-
189
-
190
-
191
-
192
-
193
-
194
-
195
-
196
-
197
-
198
-
199
-
200
-
201
-
202
-
203
-
204
-
205
-
206
-
207
-
208
-
209
-
210
-
211
-
212
-
213
-
214
-
215
-
216
-
217
-
218
-
219
-
220
-
221
-
222
-
223
-
224
-
225
-
226
-
227
-
228
-
229
-
230
-
231
-
232
-
233
-
234
-
235
-
236
-
237
-
238
-
239
-
240
-
241
-
242
-
243
-
244
-
245
-
246
-
247
-
248
-
249
-
250
-
251
-
252
-
253
-
254
-
255
-
256
 |
 |

Bank of America 2015 165
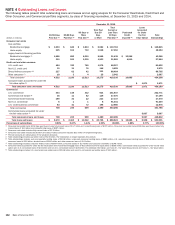
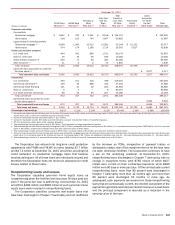
The following tables present certain credit quality indicators for the Corporation’s Consumer Real Estate, Credit Card and Other
Consumer, and Commercial portfolio segments, by class of financing receivables, at December 31, 2015 and 2014.
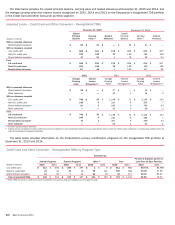
Consumer Real Estate – Credit Quality Indicators (1)
December 31, 2015
(Dollars in millions)
Core Portfolio
Residential
Mortgage (2)
Legacy Assets
& Servicing
Residential
Mortgage (2)
Residential
Mortgage PCI (3)
Core Portfolio
Home Equity (2)
Legacy Assets
& Servicing
Home Equity (2)
Home
Equity PCI
Refreshed LTV (4)
Less than or equal to 90 percent $ 109,869 $ 16,646 $ 8,655 $ 44,006 $ 15,666 $ 2,003
Greater than 90 percent but less than or equal to 100 percent 4,251 2,007 1,403 1,652 2,382 852
Greater than 100 percent 2,783 3,212 2,008 2,606 5,017 1,764
Fully-insured loans (5) 28,942 8,135 — — — —
Total consumer real estate $ 145,845 $ 30,000 $ 12,066 $ 48,264 $ 23,065 $ 4,619
Refreshed FICO score
Less than 620 $ 3,465 $ 4,408 $ 3,798 $ 1,898 $ 2,785 $ 729
Greater than or equal to 620 and less than 680 5,792 3,438 2,586 3,242 3,817 825
Greater than or equal to 680 and less than 740 22,017 5,605 3,187 9,203 6,527 1,356
Greater than or equal to 740 85,629 8,414 2,495 33,921 9,936 1,709
Fully-insured loans (5) 28,942 8,135 — — — —
Total consumer real estate $ 145,845 $ 30,000 $ 12,066 $ 48,264 $ 23,065 $ 4,619
(1) Excludes $1.9 billion of loans accounted for under the fair value option.
(2) Excludes PCI loans.
(3) Includes $2.0 billion of pay option loans. The Corporation no longer originates this product.
(4) Refreshed LTV percentages for PCI loans are calculated using the carrying value net of the related valuation allowance.
(5) Credit quality indicators are not reported for fully-insured loans as principal repayment is insured.
Credit Card and Other Consumer – Credit Quality Indicators
December 31, 2015
(Dollars in millions)
U.S. Credit
Card
Non-U.S.
Credit Card
Direct/Indirect
Consumer
Other
Consumer (1)
Refreshed FICO score
Less than 620 $ 4,196 $ — $ 1,244 $ 217
Greater than or equal to 620 and less than 680 11,857 — 1,698 214
Greater than or equal to 680 and less than 740 34,270 — 10,955 337
Greater than or equal to 740 39,279 — 29,581 1,149
Other internal credit metrics (2, 3, 4) — 9,975 45,317 150
Total credit card and other consumer $ 89,602 $ 9,975 $ 88,795 $ 2,067
(1) Twenty-seven percent of the other consumer portfolio is associated with portfolios from certain consumer finance businesses that the Corporation previously exited.
(2) Other internal credit metrics may include delinquency status, geography or other factors.
(3) Direct/indirect consumer includes $43.7 billion of securities-based lending which is overcollateralized and therefore has minimal credit risk and $567 million of loans the Corporation no longer
originates, primarily student loans.
(4) Non-U.S. credit card represents the U.K. credit card portfolio which is evaluated using internal credit metrics, including delinquency status. At December 31, 2015, 98 percent of this portfolio was
current or less than 30 days past due, one percent was 30-89 days past due and one percent was 90 days or more past due.
Commercial – Credit Quality Indicators (1)
December 31, 2015
(Dollars in millions)
U.S.
Commercial
Commercial
Real Estate
Commercial
Lease
Financing
Non-U.S.
Commercial
U.S. Small
Business
Commercial (2)
Risk ratings
Pass rated $ 243,922 $ 56,688 $ 26,050 $ 87,905 $ 571
Reservable criticized 8,849 511 1,320 3,644 96
Refreshed FICO score (3)
Less than 620 184
Greater than or equal to 620 and less than 680 543
Greater than or equal to 680 and less than 740 1,627
Greater than or equal to 740 3,027
Other internal credit metrics (3, 4) 6,828
Total commercial $ 252,771 $ 57,199 $ 27,370 $ 91,549 $ 12,876
(1) Excludes $5.1 billion of loans accounted for under the fair value option.
(2) U.S. small business commercial includes $670 million of criticized business card and small business loans which are evaluated using refreshed FICO scores or internal credit metrics, including
delinquency status, rather than risk ratings. At December 31, 2015, 98 percent of the balances where internal credit metrics are used was current or less than 30 days past due.
(3) Refreshed FICO score and other internal credit metrics are applicable only to the U.S. small business commercial portfolio.
(4) Other internal credit metrics may include delinquency status, application scores, geography or other factors.