Bank of America 2015 Annual Report Download - page 74
Download and view the complete annual report
Please find page 74 of the 2015 Bank of America annual report below. You can navigate through the pages in the report by either clicking on the pages listed below, or by using the keyword search tool below to find specific information within the annual report.-
 1
1 -
2
-
3
-
4
-
5
-
6
-
7
-
8
-
9
-
10
-
11
-
12
-
13
-
14
-
15
-
16
-
17
-
18
-
19
-
20
-
21
-
22
-
23
-
24
-
25
-
26
-
27
-
28
-
29
-
30
-
31
-
32
-
33
-
34
-
35
-
36
-
37
-
38
-
39
-
40
-
41
-
42
-
43
-
44
-
45
-
46
-
47
-
48
-
49
-
50
-
51
-
52
-
53
-
54
-
55
-
56
-
57
-
58
-
59
-
60
-
61
-
62
-
63
-
 64
64 -
 65
65 -
 66
66 -
 67
67 -
 68
68 -
 69
69 -
 70
70 -
 71
71 -
 72
72 -
 73
73 -
 74
74 -
 75
75 -
 76
76 -
 77
77 -
 78
78 -
 79
79 -
 80
80 -
 81
81 -
 82
82 -
 83
83 -
 84
84 -
85
-
86
-
87
-
88
-
89
-
90
-
91
-
92
-
93
-
94
-
95
-
96
-
97
-
98
-
99
-
100
-
101
-
102
-
103
-
104
-
105
-
106
-
107
-
108
-
109
-
110
-
111
-
112
-
113
-
114
-
115
-
116
-
117
-
118
-
119
-
120
-
121
-
122
-
123
-
124
-
125
-
126
-
127
-
128
-
129
-
130
-
131
-
132
-
133
-
134
-
135
-
136
-
137
-
138
-
139
-
140
-
141
-
142
-
143
-
144
-
145
-
146
-
147
-
148
-
149
-
150
-
151
-
152
-
153
-
154
-
155
-
156
-
157
-
158
-
159
-
160
-
161
-
162
-
163
-
164
-
165
-
166
-
167
-
168
-
169
-
170
-
171
-
172
-
173
-
174
-
175
-
176
-
177
-
178
-
179
-
180
-
181
-
182
-
183
-
184
-
185
-
186
-
187
-
188
-
189
-
190
-
191
-
192
-
193
-
194
-
195
-
196
-
197
-
198
-
199
-
200
-
201
-
202
-
203
-
204
-
205
-
206
-
207
-
208
-
209
-
210
-
211
-
212
-
213
-
214
-
215
-
216
-
217
-
218
-
219
-
220
-
221
-
222
-
223
-
224
-
225
-
226
-
227
-
228
-
229
-
230
-
231
-
232
-
233
-
234
-
235
-
236
-
237
-
238
-
239
-
240
-
241
-
242
-
243
-
244
-
245
-
246
-
247
-
248
-
249
-
250
-
251
-
252
-
253
-
254
-
255
-
256
 |
 |

72 Bank of America 2015
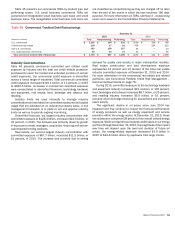
U.S. Credit Card
At December 31, 2015, 97 percent of the U.S. credit card portfolio
was managed in Consumer Banking with the remainder managed
in GWIM. Outstandings in the U.S. credit card portfolio decreased
$2.3 billion in 2015 due to portfolio divestitures. Net charge-offs
decreased $324 million to $2.3 billion in 2015 due to
improvements in delinquencies and bankruptcies as a result of
an improved economic environment and the impact of higher credit
quality originations. U.S. credit card loans 30 days or more past
due and still accruing interest decreased $126 million while loans
90 days or more past due and still accruing interest decreased
$77 million in 2015 as a result of the factors mentioned above
that contributed to lower net charge-offs.
Unused lines of credit for U.S. credit card totaled $312.5 billion
and $305.9 billion at December 31, 2015 and 2014. The $6.6
billion increase was driven by account growth and line of credit
increases.
Table 31 presents certain key credit statistics for the U.S. credit
card portfolio.
Table 31 U.S. Credit Card – Key Credit Statistics
December 31
(Dollars in millions) 2015 2014
Outstandings $ 89,602 $ 91,879
Accruing past due 30 days or more 1,575 1,701
Accruing past due 90 days or more 789 866
2015 2014
Net charge-offs $ 2,314 $ 2,638
Net charge-off ratios (1) 2.62% 2.96%
(1) Net charge-off ratios are calculated as net charge-offs divided by average outstanding loans.
Table 32 presents certain state concentrations for the U.S.
credit card portfolio.
Table 32 U.S. Credit Card State Concentrations
December 31
Outstandings
Accruing Past Due
90 Days or More Net Charge-offs
(Dollars in millions) 2015 2014 2015 2014 2015 2014
California $ 13,658 $ 13,682 $115 $ 127 $358 $ 414
Florida 7,420 7,530 81 89 244 278
Texas 6,620 6,586 58 58 157 177
New York 5,547 5,655 57 59 162 174
Washington 3,907 3,907 19 22 59 71
Other U.S. 52,450 54,519 459 511 1,334 1,524
Total U.S. credit card portfolio $ 89,602 $ 91,879 $789 $ 866 $ 2,314 $ 2,638
Non-U.S. Credit Card
Outstandings in the non-U.S. credit card portfolio, which are
recorded in All Other, decreased $490 million in 2015 due to a
weakening of the British Pound against the U.S. Dollar. Net charge-
offs decreased $54 million to $188 million in 2015 due to
improvement in delinquencies as a result of higher credit quality
originations and an improved economic environment.
Unused lines of credit for non-U.S. credit card totaled $27.9
billion and $28.2 billion at December 31, 2015 and 2014. The
$271 million decrease was driven by weakening of the British
Pound against the U.S. Dollar, partially offset by account growth
and lines of credit increases.
Table 33 presents certain key credit statistics for the non-U.S.
credit card portfolio.
Table 33 Non-U.S. Credit Card – Key Credit Statistics
December 31
(Dollars in millions) 2015 2014
Outstandings $ 9,975 $ 10,465
Accruing past due 30 days or more 146 183
Accruing past due 90 days or more 76 95
2015 2014
Net charge-offs $ 188 $ 242
Net charge-off ratios (1) 1.86% 2.10%
(1) Net charge-off ratios are calculated as net charge-offs divided by average outstanding loans.