Bank of America 2015 Annual Report Download - page 230
Download and view the complete annual report
Please find page 230 of the 2015 Bank of America annual report below. You can navigate through the pages in the report by either clicking on the pages listed below, or by using the keyword search tool below to find specific information within the annual report.-
 1
1 -
2
-
3
-
4
-
5
-
6
-
7
-
8
-
9
-
10
-
11
-
12
-
13
-
14
-
15
-
16
-
17
-
18
-
19
-
20
-
21
-
22
-
23
-
24
-
25
-
26
-
27
-
28
-
29
-
30
-
31
-
32
-
33
-
34
-
35
-
36
-
37
-
38
-
39
-
40
-
41
-
42
-
43
-
44
-
45
-
46
-
47
-
48
-
49
-
50
-
51
-
52
-
53
-
54
-
55
-
56
-
57
-
58
-
59
-
60
-
61
-
62
-
63
-
64
-
65
-
66
-
67
-
68
-
69
-
70
-
71
-
72
-
73
-
74
-
75
-
76
-
77
-
78
-
79
-
80
-
81
-
82
-
83
-
84
-
85
-
86
-
87
-
88
-
89
-
90
-
91
-
92
-
93
-
94
-
95
-
96
-
97
-
98
-
99
-
100
-
101
-
102
-
103
-
104
-
105
-
106
-
107
-
108
-
109
-
110
-
111
-
112
-
113
-
114
-
115
-
116
-
117
-
118
-
119
-
120
-
121
-
122
-
123
-
124
-
125
-
126
-
127
-
128
-
129
-
130
-
131
-
132
-
133
-
134
-
135
-
136
-
137
-
138
-
139
-
140
-
141
-
142
-
143
-
144
-
145
-
146
-
147
-
148
-
149
-
150
-
151
-
152
-
153
-
154
-
155
-
156
-
157
-
158
-
159
-
160
-
161
-
162
-
163
-
164
-
165
-
166
-
167
-
168
-
169
-
170
-
171
-
172
-
173
-
174
-
175
-
176
-
177
-
178
-
179
-
180
-
181
-
182
-
183
-
184
-
185
-
186
-
187
-
188
-
189
-
190
-
191
-
192
-
193
-
194
-
195
-
196
-
197
-
198
-
199
-
200
-
201
-
202
-
203
-
204
-
205
-
206
-
207
-
208
-
209
-
210
-
211
-
212
-
213
-
214
-
215
-
216
-
217
-
218
-
219
-
 220
220 -
 221
221 -
 222
222 -
 223
223 -
 224
224 -
 225
225 -
 226
226 -
 227
227 -
 228
228 -
 229
229 -
 230
230 -
 231
231 -
 232
232 -
 233
233 -
 234
234 -
 235
235 -
 236
236 -
 237
237 -
 238
238 -
 239
239 -
 240
240 -
241
-
242
-
243
-
244
-
245
-
246
-
247
-
248
-
249
-
250
-
251
-
252
-
253
-
254
-
255
-
256
 |
 |

228 Bank of America 2015
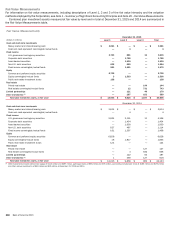
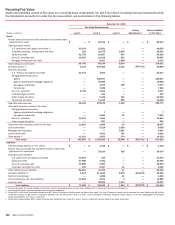
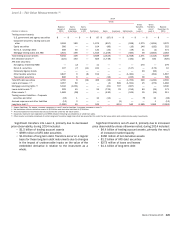
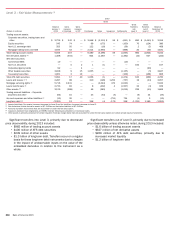
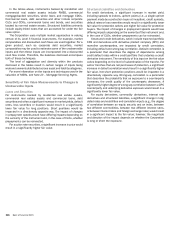
The following tables present a reconciliation of all assets and liabilities measured at fair value on a recurring basis using significant
unobservable inputs (Level 3) during 2015, 2014 and 2013, including net realized and unrealized gains (losses) included in earnings
and accumulated OCI.
Level 3 – Fair Value Measurements (1)
2015
Gross
(Dollars in millions)
Balance
January 1
2015
Gains
(Losses)
in Earnings
Gains
(Losses)
in OCI (2) Purchases Sales Issuances Settlements
Gross
Transfers
into
Level 3
Gross
Transfers
out of
Level 3
Balance
December 31
2015
Trading account assets:
Corporate securities, trading loans and
other $ 3,270 $ (31) $ (11) $ 1,540 $ (1,616)$ — $ (1,122) $ 1,570 $ (762) $ 2,838
Equity securities 352 9 — 49 (11) — (11) 41 (22) 407
Non-U.S. sovereign debt 574 114 (179) 185 (1) — (145) —(27) 521
Mortgage trading loans and ABS 2,063 154 1 1,250 (1,117) — (493) 50 (40) 1,868
Total trading account assets 6,259 246 (189) 3,024 (2,745)—
(1,771) 1,661 (851) 5,634
Net derivative assets (3) (920) 1,335 (7) 273 (863) — (261) (40) 42 (441)
AFS debt securities:
Non-agency residential MBS 279 (12) — 134 — — (425) 167 (37) 106
Non-U.S. securities 10 — — — — — (10) —— —
Other taxable securities 1,667 — — 189 — — (160) — (939) 757
Tax-exempt securities 599 — — — — — (30) ——
569
Total AFS debt securities 2,555 (12) — 323 — — (625) 167 (976) 1,432
Other debt securities carried at fair value –
Non-agency residential MBS — (3) — 33 — — — —— 30
Loans and leases (4, 5) 1,983 (23) — — (4) 57 (237) 144 (300) 1,620
Mortgage servicing rights (5) 3,530 187 — — (393) 637 (874) ——
3,087
Loans held-for-sale (4) 173 (51) (8) 771 (203) 61 (61) 203 (98) 787
Other assets (6) 911 (55) — 11 (130) — (51) 10 (322) 374
Federal funds purchased and securities
loaned or sold under agreements to
repurchase (4) — (11) — — — (131) 217 (411) 1 (335)
Trading account liabilities – Corporate
securities and other (36) 19 — 30 (34) — — ——(21)
Short-term borrowings (4) — 17 — — — (52) 10 (24) 19 (30)
Accrued expenses and other liabilities (10) 1 — — — — — —— (9)
Long-term debt (4) (2,362) 287 19 616 — (188) 273 (1,592) 1,434 (1,513)
(1) Assets (liabilities). For assets, increase (decrease) to Level 3 and for liabilities, (increase) decrease to Level 3.
(2) Includes unrealized gains (losses) on AFS debt securities, foreign currency translation adjustments and the impact on structured liabilities of changes in the Corporation’s credit spreads. For more
information, see Note 1 – Summary of Significant Accounting Principles.
(3) Net derivatives include derivative assets of $5.1 billion and derivative liabilities of $5.6 billion.
(4) Amounts represent instruments that are accounted for under the fair value option.
(5) Issuances represent loan originations and MSRs retained following securitizations or whole-loan sales.
(6) Other assets is primarily comprised of certain private equity investments.
Significant transfers into Level 3, primarily due to decreased
price observability, during 2015 included:
$1.7 billion of trading account assets
$167 million of AFS debt securities
$144 million of loans and leases
$203 million of LHFS
$411 million of federal funds purchased and securities
loaned or sold under agreements to repurchase
$1.6 billion of long-term debt. Transfers occur on a regular
basis for these long-term debt instruments due to changes
in the impact of unobservable inputs on the value of the
embedded derivative in relation to the instrument as a
whole.
Significant transfers out of Level 3, primarily due to increased
price observability unless otherwise noted, during 2015 included:
$851 million of trading account assets, primarily the result
of increased market liquidity
$976 million of AFS debt securities
$300 million of loans and leases
$322 million of other assets
$1.4 billion of long-term debt