Bank of America 2015 Annual Report Download - page 236
Download and view the complete annual report
Please find page 236 of the 2015 Bank of America annual report below. You can navigate through the pages in the report by either clicking on the pages listed below, or by using the keyword search tool below to find specific information within the annual report.-
 1
1 -
2
-
3
-
4
-
5
-
6
-
7
-
8
-
9
-
10
-
11
-
12
-
13
-
14
-
15
-
16
-
17
-
18
-
19
-
20
-
21
-
22
-
23
-
24
-
25
-
26
-
27
-
28
-
29
-
30
-
31
-
32
-
33
-
34
-
35
-
36
-
37
-
38
-
39
-
40
-
41
-
42
-
43
-
44
-
45
-
46
-
47
-
48
-
49
-
50
-
51
-
52
-
53
-
54
-
55
-
56
-
57
-
58
-
59
-
60
-
61
-
62
-
63
-
64
-
65
-
66
-
67
-
68
-
69
-
70
-
71
-
72
-
73
-
74
-
75
-
76
-
77
-
78
-
79
-
80
-
81
-
82
-
83
-
84
-
85
-
86
-
87
-
88
-
89
-
90
-
91
-
92
-
93
-
94
-
95
-
96
-
97
-
98
-
99
-
100
-
101
-
102
-
103
-
104
-
105
-
106
-
107
-
108
-
109
-
110
-
111
-
112
-
113
-
114
-
115
-
116
-
117
-
118
-
119
-
120
-
121
-
122
-
123
-
124
-
125
-
126
-
127
-
128
-
129
-
130
-
131
-
132
-
133
-
134
-
135
-
136
-
137
-
138
-
139
-
140
-
141
-
142
-
143
-
144
-
145
-
146
-
147
-
148
-
149
-
150
-
151
-
152
-
153
-
154
-
155
-
156
-
157
-
158
-
159
-
160
-
161
-
162
-
163
-
164
-
165
-
166
-
167
-
168
-
169
-
170
-
171
-
172
-
173
-
174
-
175
-
176
-
177
-
178
-
179
-
180
-
181
-
182
-
183
-
184
-
185
-
186
-
187
-
188
-
189
-
190
-
191
-
192
-
193
-
194
-
195
-
196
-
197
-
198
-
199
-
200
-
201
-
202
-
203
-
204
-
205
-
206
-
207
-
208
-
209
-
210
-
211
-
212
-
213
-
214
-
215
-
216
-
217
-
218
-
219
-
220
-
221
-
222
-
223
-
224
-
225
-
 226
226 -
 227
227 -
 228
228 -
 229
229 -
 230
230 -
 231
231 -
 232
232 -
 233
233 -
 234
234 -
 235
235 -
 236
236 -
 237
237 -
 238
238 -
 239
239 -
 240
240 -
 241
241 -
 242
242 -
 243
243 -
 244
244 -
 245
245 -
 246
246 -
247
-
248
-
249
-
250
-
251
-
252
-
253
-
254
-
255
-
256
 |
 |

234 Bank of America 2015
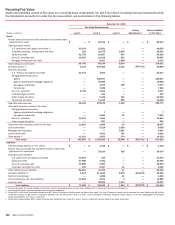
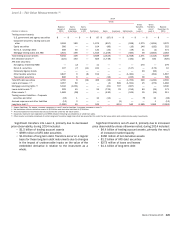
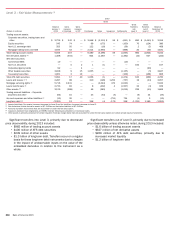
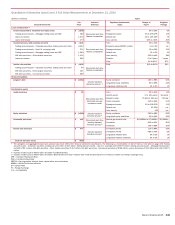
The following tables present information about significant unobservable inputs related to the Corporation’s material categories of
Level 3 financial assets and liabilities at December 31, 2015 and 2014.
Quantitative Information about Level 3 Fair Value Measurements at December 31, 2015
(Dollars in millions) Inputs
Financial Instrument
Fair
Value
Valuation
Technique
Significant Unobservable
Inputs
Ranges of
Inputs
Weighted
Average
Loans and Securities (1)
Instruments backed by residential real estate assets $ 2,017
Discounted cash flow,
Market comparables
Yield 0% to 25% 6%
Trading account assets – Mortgage trading loans and ABS 400 Prepayment speed 0% to 27% CPR 11%
Loans and leases 1,520 Default rate 0% to 10% CDR 4%
Loans held-for-sale 97 Loss severity 0% to 90% 40%
Instruments backed by commercial real estate assets $ 852
Discounted cash flow,
Market comparables
Yield 0% to 25% 8%
Trading account assets – Mortgage trading loans and ABS 162 Price $0 to $100 $73
Loans held-for-sale 690
Commercial loans, debt securities and other $ 4,558
Discounted cash flow,
Market comparables
Yield 0% to 37% 13%
Trading account assets – Corporate securities, trading loans and other 2,503 Prepayment speed 5% to 20% 16%
Trading account assets – Non-U.S. sovereign debt 521 Default rate 2% to 5% 4%
Trading account assets – Mortgage trading loans and ABS 1,306 Loss severity 25% to 50% 37%
AFS debt securities – Other taxable securities 128 Duration 0 to 5 years 3 years
Loans and leases 100 Price $0 to $258 $64
Auction rate securities $ 1,533
Discounted cash flow,
Market comparables
Price $10 to $100 $94
Trading account assets – Corporate securities, trading loans and other 335
AFS debt securities – Other taxable securities 629
AFS debt securities – Tax-exempt securities 569
Structured liabilities
Long-term debt $ (1,513) Industry standard
derivative pricing (2, 3)
Equity correlation 25% to 100% 67%
Long-dated equity volatilities 4% to 101% 28%
Net derivative assets
Credit derivatives $ (75)
Discounted cash flow,
Stochastic recovery
correlation model
Yield 6% to 25% 16%
Upfront points 0 to 100 points 60 points
Credit spreads 0 bps to 447 bps 111 bps
Credit correlation 31% to 99% 38%
Prepayment speed 10% to 20% CPR 19%
Default rate 1% to 4% CDR 3%
Loss severity 35% to 40% 35%
Equity derivatives $ (1,037) Industry standard
derivative pricing (2)
Equity correlation 25% to 100% 67%
Long-dated equity volatilities 4% to 101% 28%
Commodity derivatives $ 169
Discounted cash flow,
Industry standard
derivative pricing (2)
Natural gas forward price $1/MMBtu to $6/MMBtu $4/MMBtu
Propane forward price $0/Gallon to $1/Gallon $1/Gallon
Correlation 66% to 93% 84%
Volatilities 18% to 125% 39%
Interest rate derivatives $ 502
Industry standard
derivative pricing (3)
Correlation (IR/IR) 17% to 99% 48%
Correlation (FX/IR) -15% to 40% -9%
Long-dated inflation rates 0% to 7% 3%
Long-dated inflation volatilities 0% to 2% 1%
Total net derivative assets $ (441)
(1) The categories are aggregated based upon product type which differs from financial statement classification. The following is a reconciliation to the line items in the table on page 228: Trading
account assets – Corporate securities, trading loans and other of $2.8 billion, Trading account assets – Non-U.S. sovereign debt of $521 million, Trading account assets – Mortgage trading loans
and ABS of $1.9 billion, AFS debt securities – Other taxable securities of $757 million, AFS debt securities – Tax-exempt securities of $569 million, Loans and leases of $1.6 billion and LHFS of
$787 million.
(2) Includes models such as Monte Carlo simulation and Black-Scholes.
(3) Includes models such as Monte Carlo simulation, Black-Scholes and other methods that model the joint dynamics of interest, inflation and foreign exchange rates.
CPR = Constant Prepayment Rate
CDR = Constant Default Rate
MMBtu = Million British thermal units
IR = Interest Rate
FX = Foreign Exchange