Bank of America 2015 Annual Report Download - page 220
Download and view the complete annual report
Please find page 220 of the 2015 Bank of America annual report below. You can navigate through the pages in the report by either clicking on the pages listed below, or by using the keyword search tool below to find specific information within the annual report.-
 1
1 -
2
-
3
-
4
-
5
-
6
-
7
-
8
-
9
-
10
-
11
-
12
-
13
-
14
-
15
-
16
-
17
-
18
-
19
-
20
-
21
-
22
-
23
-
24
-
25
-
26
-
27
-
28
-
29
-
30
-
31
-
32
-
33
-
34
-
35
-
36
-
37
-
38
-
39
-
40
-
41
-
42
-
43
-
44
-
45
-
46
-
47
-
48
-
49
-
50
-
51
-
52
-
53
-
54
-
55
-
56
-
57
-
58
-
59
-
60
-
61
-
62
-
63
-
64
-
65
-
66
-
67
-
68
-
69
-
70
-
71
-
72
-
73
-
74
-
75
-
76
-
77
-
78
-
79
-
80
-
81
-
82
-
83
-
84
-
85
-
86
-
87
-
88
-
89
-
90
-
91
-
92
-
93
-
94
-
95
-
96
-
97
-
98
-
99
-
100
-
101
-
102
-
103
-
104
-
105
-
106
-
107
-
108
-
109
-
110
-
111
-
112
-
113
-
114
-
115
-
116
-
117
-
118
-
119
-
120
-
121
-
122
-
123
-
124
-
125
-
126
-
127
-
128
-
129
-
130
-
131
-
132
-
133
-
134
-
135
-
136
-
137
-
138
-
139
-
140
-
141
-
142
-
143
-
144
-
145
-
146
-
147
-
148
-
149
-
150
-
151
-
152
-
153
-
154
-
155
-
156
-
157
-
158
-
159
-
160
-
161
-
162
-
163
-
164
-
165
-
166
-
167
-
168
-
169
-
170
-
171
-
172
-
173
-
174
-
175
-
176
-
177
-
178
-
179
-
180
-
181
-
182
-
183
-
184
-
185
-
186
-
187
-
188
-
189
-
190
-
191
-
192
-
193
-
194
-
195
-
196
-
197
-
198
-
199
-
200
-
201
-
202
-
203
-
204
-
205
-
206
-
207
-
208
-
209
-
 210
210 -
 211
211 -
 212
212 -
 213
213 -
 214
214 -
 215
215 -
 216
216 -
 217
217 -
 218
218 -
 219
219 -
 220
220 -
 221
221 -
 222
222 -
 223
223 -
 224
224 -
 225
225 -
 226
226 -
 227
227 -
 228
228 -
 229
229 -
 230
230 -
231
-
232
-
233
-
234
-
235
-
236
-
237
-
238
-
239
-
240
-
241
-
242
-
243
-
244
-
245
-
246
-
247
-
248
-
249
-
250
-
251
-
252
-
253
-
254
-
255
-
256
 |
 |

218 Bank of America 2015
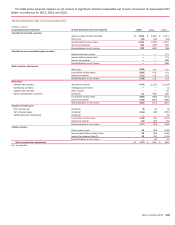
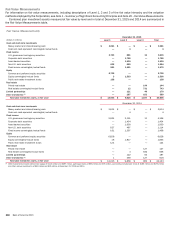
Fair Value Measurements
For information on fair value measurements, including descriptions of Level 1, 2 and 3 of the fair value hierarchy and the valuation
methods employed by the Corporation, see Note 1 – Summary of Significant Accounting Principles and Note 20 – Fair Value Measurements.
Combined plan investment assets measured at fair value by level and in total at December 31, 2015 and 2014 are summarized in
the Fair Value Measurements table.
Fair Value Measurements
December 31, 2015
(Dollars in millions) Level 1 Level 2 Level 3 Total
Cash and short-term investments
Money market and interest-bearing cash $ 3,061 $ — $ —$ 3,061
Cash and cash equivalent commingled/mutual funds — 4 —4
Fixed income
U.S. government and agency securities 2,723 881 11 3,615
Corporate debt securities — 1,795 —1,795
Asset-backed securities — 1,939 —1,939
Non-U.S. debt securities 632 662 — 1,294
Fixed income commingled/mutual funds 551 1,421 —1,972
Equity
Common and preferred equity securities 6,735 — —6,735
Equity commingled/mutual funds 3 1,503 —1,506
Public real estate investment trusts 138 ——138
Real estate
Private real estate — — 144 144
Real estate commingled/mutual funds — 12 731 743
Limited partnerships — 121 49 170
Other investments (1) —287 102 389
Total plan investment assets, at fair value $ 13,843 $ 8,625 $ 1,037 $ 23,505
December 31, 2014
Cash and short-term investments
Money market and interest-bearing cash $ 3,814 $ — $ — $ 3,814
Cash and cash equivalent commingled/mutual funds — 4 — 4
Fixed income
U.S. government and agency securities 2,004 2,151 11 4,166
Corporate debt securities — 1,454 — 1,454
Asset-backed securities — 1,930 — 1,930
Non-U.S. debt securities 627 487 — 1,114
Fixed income commingled/mutual funds 101 1,397 — 1,498
Equity
Common and preferred equity securities 6,628 — — 6,628
Equity commingled/mutual funds 16 1,817 — 1,833
Public real estate investment trusts 124 — — 124
Real estate
Private real estate — — 127 127
Real estate commingled/mutual funds — 4 632 636
Limited partnerships — 122 65 187
Other investments (1) 1 490 127 618
Total plan investment assets, at fair value $ 13,315 $ 9,856 $ 962 $ 24,133
(1) Other investments include interest rate swaps of $114 million and $297 million, participant loans of $58 million and $78 million, commodity and balanced funds of $165 million and $178 million
and other various investments of $52 million and $65 million at December 31, 2015 and 2014.