Bank of America 2015 Annual Report Download - page 248
Download and view the complete annual report
Please find page 248 of the 2015 Bank of America annual report below. You can navigate through the pages in the report by either clicking on the pages listed below, or by using the keyword search tool below to find specific information within the annual report.-
 1
1 -
2
-
3
-
4
-
5
-
6
-
7
-
8
-
9
-
10
-
11
-
12
-
13
-
14
-
15
-
16
-
17
-
18
-
19
-
20
-
21
-
22
-
23
-
24
-
25
-
26
-
27
-
28
-
29
-
30
-
31
-
32
-
33
-
34
-
35
-
36
-
37
-
38
-
39
-
40
-
41
-
42
-
43
-
44
-
45
-
46
-
47
-
48
-
49
-
50
-
51
-
52
-
53
-
54
-
55
-
56
-
57
-
58
-
59
-
60
-
61
-
62
-
63
-
64
-
65
-
66
-
67
-
68
-
69
-
70
-
71
-
72
-
73
-
74
-
75
-
76
-
77
-
78
-
79
-
80
-
81
-
82
-
83
-
84
-
85
-
86
-
87
-
88
-
89
-
90
-
91
-
92
-
93
-
94
-
95
-
96
-
97
-
98
-
99
-
100
-
101
-
102
-
103
-
104
-
105
-
106
-
107
-
108
-
109
-
110
-
111
-
112
-
113
-
114
-
115
-
116
-
117
-
118
-
119
-
120
-
121
-
122
-
123
-
124
-
125
-
126
-
127
-
128
-
129
-
130
-
131
-
132
-
133
-
134
-
135
-
136
-
137
-
138
-
139
-
140
-
141
-
142
-
143
-
144
-
145
-
146
-
147
-
148
-
149
-
150
-
151
-
152
-
153
-
154
-
155
-
156
-
157
-
158
-
159
-
160
-
161
-
162
-
163
-
164
-
165
-
166
-
167
-
168
-
169
-
170
-
171
-
172
-
173
-
174
-
175
-
176
-
177
-
178
-
179
-
180
-
181
-
182
-
183
-
184
-
185
-
186
-
187
-
188
-
189
-
190
-
191
-
192
-
193
-
194
-
195
-
196
-
197
-
198
-
199
-
200
-
201
-
202
-
203
-
204
-
205
-
206
-
207
-
208
-
209
-
210
-
211
-
212
-
213
-
214
-
215
-
216
-
217
-
218
-
219
-
220
-
221
-
222
-
223
-
224
-
225
-
226
-
227
-
228
-
229
-
230
-
231
-
232
-
233
-
234
-
235
-
236
-
237
-
 238
238 -
 239
239 -
 240
240 -
 241
241 -
 242
242 -
 243
243 -
 244
244 -
 245
245 -
 246
246 -
 247
247 -
 248
248 -
 249
249 -
 250
250 -
 251
251 -
 252
252 -
 253
253 -
 254
254 -
 255
255 -
 256
256
 |
 |

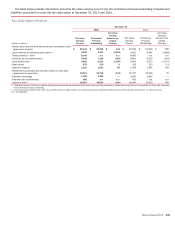
246 Bank of America 2015
The table below presents a reconciliation of the five business segments’ total revenue, net of interest expense, on an FTE basis,
and net income to the Consolidated Statement of Income, and total assets to the Consolidated Balance Sheet. The adjustments
presented in the table below include consolidated income, expense and asset amounts not specifically allocated to individual business
segments.
Business Segment Reconciliations
(Dollars in millions) 2015 2014 2013
Segments’ total revenue, net of interest expense (FTE basis) $ 84,035 $ 85,684 $ 87,040
Adjustments:
ALM activities 237 (804) (545)
Equity investment income —727 2,737
Liquidating businesses and other (856) (491) 569
FTE basis adjustment (909) (869) (859)
Consolidated revenue, net of interest expense $ 82,507 $ 84,247 $ 88,942
Segments’ total net income $ 16,377 $ 4,769 $ 10,714
Adjustments, net-of-taxes:
ALM activities (305) (343) (929)
Equity investment income —454 1,724
Liquidating businesses and other (184) (47) (78)
Consolidated net income $ 15,888 $ 4,833 $ 11,431
December 31
2015 2014
Segments’ total assets $1,913,525 $ 1,842,953
Adjustments:
ALM activities, including securities portfolio 681,876 658,319
Equity investments 4,297 4,871
Liquidating businesses and other 63,465 73,008
Elimination of segment asset allocations to match liabilities (518,847)(474,617)
Consolidated total assets $ 2,144,316 $ 2,104,534