Bank of America 2015 Annual Report Download - page 223
Download and view the complete annual report
Please find page 223 of the 2015 Bank of America annual report below. You can navigate through the pages in the report by either clicking on the pages listed below, or by using the keyword search tool below to find specific information within the annual report.-
 1
1 -
2
-
3
-
4
-
5
-
6
-
7
-
8
-
9
-
10
-
11
-
12
-
13
-
14
-
15
-
16
-
17
-
18
-
19
-
20
-
21
-
22
-
23
-
24
-
25
-
26
-
27
-
28
-
29
-
30
-
31
-
32
-
33
-
34
-
35
-
36
-
37
-
38
-
39
-
40
-
41
-
42
-
43
-
44
-
45
-
46
-
47
-
48
-
49
-
50
-
51
-
52
-
53
-
54
-
55
-
56
-
57
-
58
-
59
-
60
-
61
-
62
-
63
-
64
-
65
-
66
-
67
-
68
-
69
-
70
-
71
-
72
-
73
-
74
-
75
-
76
-
77
-
78
-
79
-
80
-
81
-
82
-
83
-
84
-
85
-
86
-
87
-
88
-
89
-
90
-
91
-
92
-
93
-
94
-
95
-
96
-
97
-
98
-
99
-
100
-
101
-
102
-
103
-
104
-
105
-
106
-
107
-
108
-
109
-
110
-
111
-
112
-
113
-
114
-
115
-
116
-
117
-
118
-
119
-
120
-
121
-
122
-
123
-
124
-
125
-
126
-
127
-
128
-
129
-
130
-
131
-
132
-
133
-
134
-
135
-
136
-
137
-
138
-
139
-
140
-
141
-
142
-
143
-
144
-
145
-
146
-
147
-
148
-
149
-
150
-
151
-
152
-
153
-
154
-
155
-
156
-
157
-
158
-
159
-
160
-
161
-
162
-
163
-
164
-
165
-
166
-
167
-
168
-
169
-
170
-
171
-
172
-
173
-
174
-
175
-
176
-
177
-
178
-
179
-
180
-
181
-
182
-
183
-
184
-
185
-
186
-
187
-
188
-
189
-
190
-
191
-
192
-
193
-
194
-
195
-
196
-
197
-
198
-
199
-
200
-
201
-
202
-
203
-
204
-
205
-
206
-
207
-
208
-
209
-
210
-
211
-
212
-
 213
213 -
 214
214 -
 215
215 -
 216
216 -
 217
217 -
 218
218 -
 219
219 -
 220
220 -
 221
221 -
 222
222 -
 223
223 -
 224
224 -
 225
225 -
 226
226 -
 227
227 -
 228
228 -
 229
229 -
 230
230 -
 231
231 -
 232
232 -
 233
233 -
234
-
235
-
236
-
237
-
238
-
239
-
240
-
241
-
242
-
243
-
244
-
245
-
246
-
247
-
248
-
249
-
250
-
251
-
252
-
253
-
254
-
255
-
256
 |
 |

Bank of America 2015 221
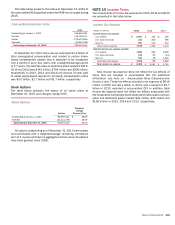
The table below presents the status at December 31, 2015 of
the cash-settled RSUs granted under the KASP and changes during
2015.
Cash-settled Restricted Units
Units
Outstanding at January 1, 2015 316,956,435
Granted 128,748,571
Vested (176,407,854)
Canceled (13,942,138)
Outstanding at December 31, 2015 255,355,014
At December 31, 2015, there was an estimated $1.2 billion of
total unrecognized compensation cost related to certain share-
based compensation awards that is expected to be recognized
over a period of up to four years, with a weighted-average period
of 1.7 years. The total fair value of restricted stock vested in 2015,
2014 and 2013 was $145 million, $704 million and $906 million,
respectively. In 2015, 2014 and 2013, the amount of cash paid
to settle equity-based awards for all equity compensation plans
was $3.0 billion, $2.7 billion and $1.7 billion, respectively.
Stock Options
The table below presents the status of all option plans at
December 31, 2015 and changes during 2015.
Stock Options
Options
Weighted-
average
Exercise Price
Outstanding at January 1, 2015 88,087,054 $ 48.96
Forfeited (24,211,579) 48.38
Outstanding at December 31, 2015 63,875,475 49.18
All options outstanding as of December 31, 2015 were vested
and exercisable with a weighted-average remaining contractual
term of 1.1 years and have no aggregate intrinsic value. No options
have been granted since 2008.
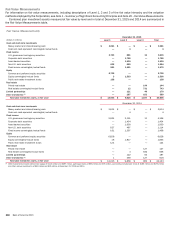
NOTE 19 Income Taxes
The components of income tax expense for 2015, 2014 and 2013
are presented in the table below.
Income Tax Expense
(Dollars in millions) 2015 2014 2013
Current income tax expense
U.S. federal $ 2,387 $ 443 $ 180
U.S. state and local 210 340 786
Non-U.S. 561 513 513
Total current expense 3,158 1,296 1,479
Deferred income tax expense (benefit)
U.S. federal 1,992 583 2,056
U.S. state and local 519 85 (94)
Non-U.S. 597 58 1,300
Total deferred expense 3,108 726 3,262
Total income tax expense $ 6,266 $ 2,022 $ 4,741
Total income tax expense does not reflect the tax effects of
items that are included in accumulated OCI. For additional
information, see Note 14 – Accumulated Other Comprehensive
Income (Loss). These tax effects resulted in an expense of $616
million in 2015 and $3.4 billion in 2014, and a benefit of $2.7
billion in 2013, recorded in accumulated OCI. In addition, total
income tax expense does not reflect tax effects associated with
the Corporation’s employee stock plans which decreased common
stock and additional paid-in capital $44 million, $35 million and
$128 million in 2015, 2014 and 2013, respectively.