Bank of America 2015 Annual Report Download - page 216
Download and view the complete annual report
Please find page 216 of the 2015 Bank of America annual report below. You can navigate through the pages in the report by either clicking on the pages listed below, or by using the keyword search tool below to find specific information within the annual report.-
 1
1 -
2
-
3
-
4
-
5
-
6
-
7
-
8
-
9
-
10
-
11
-
12
-
13
-
14
-
15
-
16
-
17
-
18
-
19
-
20
-
21
-
22
-
23
-
24
-
25
-
26
-
27
-
28
-
29
-
30
-
31
-
32
-
33
-
34
-
35
-
36
-
37
-
38
-
39
-
40
-
41
-
42
-
43
-
44
-
45
-
46
-
47
-
48
-
49
-
50
-
51
-
52
-
53
-
54
-
55
-
56
-
57
-
58
-
59
-
60
-
61
-
62
-
63
-
64
-
65
-
66
-
67
-
68
-
69
-
70
-
71
-
72
-
73
-
74
-
75
-
76
-
77
-
78
-
79
-
80
-
81
-
82
-
83
-
84
-
85
-
86
-
87
-
88
-
89
-
90
-
91
-
92
-
93
-
94
-
95
-
96
-
97
-
98
-
99
-
100
-
101
-
102
-
103
-
104
-
105
-
106
-
107
-
108
-
109
-
110
-
111
-
112
-
113
-
114
-
115
-
116
-
117
-
118
-
119
-
120
-
121
-
122
-
123
-
124
-
125
-
126
-
127
-
128
-
129
-
130
-
131
-
132
-
133
-
134
-
135
-
136
-
137
-
138
-
139
-
140
-
141
-
142
-
143
-
144
-
145
-
146
-
147
-
148
-
149
-
150
-
151
-
152
-
153
-
154
-
155
-
156
-
157
-
158
-
159
-
160
-
161
-
162
-
163
-
164
-
165
-
166
-
167
-
168
-
169
-
170
-
171
-
172
-
173
-
174
-
175
-
176
-
177
-
178
-
179
-
180
-
181
-
182
-
183
-
184
-
185
-
186
-
187
-
188
-
189
-
190
-
191
-
192
-
193
-
194
-
195
-
196
-
197
-
198
-
199
-
200
-
201
-
202
-
203
-
204
-
205
-
 206
206 -
 207
207 -
 208
208 -
 209
209 -
 210
210 -
 211
211 -
 212
212 -
 213
213 -
 214
214 -
 215
215 -
 216
216 -
 217
217 -
 218
218 -
 219
219 -
 220
220 -
 221
221 -
 222
222 -
 223
223 -
 224
224 -
 225
225 -
 226
226 -
227
-
228
-
229
-
230
-
231
-
232
-
233
-
234
-
235
-
236
-
237
-
238
-
239
-
240
-
241
-
242
-
243
-
244
-
245
-
246
-
247
-
248
-
249
-
250
-
251
-
252
-
253
-
254
-
255
-
256
 |
 |

214 Bank of America 2015
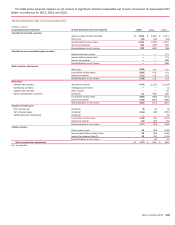
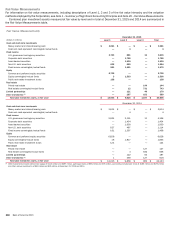
The Corporation’s best estimate of its contributions to be made to the Non-U.S. Pension Plans, Nonqualified and Other Pension
Plans, and Postretirement Health and Life Plans in 2016 is $50 million, $103 million and $108 million, respectively. The Corporation
does not expect to make a contribution to the Qualified Pension Plan in 2016.
Pension and Postretirement Plans
Qualified
Pension Plan (1)
Non-U.S.
Pension Plans (1)
Nonqualified
and Other
Pension Plans (1)
Postretirement
Health and Life
Plans (1)
(Dollars in millions) 2015 2014 2015 2014 2015 2014 2015 2014
Change in fair value of plan assets
Fair value, January 1 $ 18,614 $ 18,276 $ 2,564 $ 2,457 $ 2,927 $ 2,720 $28 $72
Actual return on plan assets 199 1,261 342 256 14 336 —6
Company contributions ——58 84 97 97 79 53
Plan participant contributions ——11——127 129
Settlements and curtailments ——(7) (5) ————
Benefits paid (851) (923) (78) (68) (233) (226) (247)(248)
Federal subsidy on benefits paid n/a n/a n/a n/a n/a n/a 13 16
Foreign currency exchange rate changes n/a n/a (142) (161) n/a n/a n/a n/a
Fair value, December 31 $ 17,962 $ 18,614 $ 2,738 $ 2,564 $ 2,805 $ 2,927 $—$28
Change in projected benefit obligation
Projected benefit obligation, January 1 $ 15,508 $ 14,145 $ 2,688 $ 2,580 $ 3,329 $ 3,070 $ 1,346 $1,356
Service cost ——27 29 —188
Interest cost 621 665 93 109 122 133 48 58
Plan participant contributions ——11——127 129
Plan amendments ——(1) 1————
Settlements and curtailments ——(7) (6) ————
Actuarial loss (gain) (817) 1,621 (2) 208 (165) 351 (141)29
Benefits paid (851) (923) (78) (68) (233) (226) (247)(248)
Federal subsidy on benefits paid n/a n/a n/a n/a n/a n/a 13 16
Foreign currency exchange rate changes n/a n/a (141) (166) n/a n/a (2)(2)
Projected benefit obligation, December 31 $ 14,461 $ 15,508 $ 2,580 $ 2,688 $ 3,053 $ 3,329 $ 1,152 $1,346
Amount recognized, December 31 $ 3,501 $ 3,106 $158 $ (124) $ (248) $ (402) $(1,152)$ (1,318)
Funded status, December 31
Accumulated benefit obligation $ 14,461 $ 15,508 $ 2,479 $ 2,582 $ 3,052 $ 3,329 n/a n/a
Overfunded (unfunded) status of ABO 3,501 3,106 259 (18) (247) (402) n/a n/a
Provision for future salaries ——101 106 1—n/a n/a
Projected benefit obligation 14,461 15,508 2,580 2,688 3,053 3,329 $ 1,152 $1,346
Weighted-average assumptions, December 31
Discount rate 4.51% 4.12% 3.59%3.56% 4.34%3.80% 4.32%3.75%
Rate of compensation increase n/a n/a 4.64 4.70 4.00 4.00 n/a n/a
(1) The measurement date for the Qualified Pension Plan, Non-U.S. Pension Plans, Nonqualified and Other Pension Plans, and Postretirement Health and Life Plans was December 31 of each year
reported.
n/a = not applicable
Amounts recognized on the Consolidated Balance Sheet at December 31, 2015 and 2014 are presented in the table below.
Amounts Recognized on Consolidated Balance Sheet
Qualified
Pension Plan
Non-U.S.
Pension Plans
Nonqualified
and Other
Pension Plans
Postretirement
Health and Life
Plans
(Dollars in millions) 2015 2014 2015 2014 2015 2014 2015 2014
Other assets $ 3,501 $ 3,106 $548 $ 252 $825 $ 786 $—$—
Accrued expenses and other liabilities ——(390) (376) (1,073)(1,188) (1,152)(1,318)
Net amount recognized at December 31 $ 3,501 $ 3,106 $158 $ (124) $ (248) $ (402) $(1,152)$ (1,318)