Bank of America 2015 Annual Report Download - page 121
Download and view the complete annual report
Please find page 121 of the 2015 Bank of America annual report below. You can navigate through the pages in the report by either clicking on the pages listed below, or by using the keyword search tool below to find specific information within the annual report.-
 1
1 -
2
-
3
-
4
-
5
-
6
-
7
-
8
-
9
-
10
-
11
-
12
-
13
-
14
-
15
-
16
-
17
-
18
-
19
-
20
-
21
-
22
-
23
-
24
-
25
-
26
-
27
-
28
-
29
-
30
-
31
-
32
-
33
-
34
-
35
-
36
-
37
-
38
-
39
-
40
-
41
-
42
-
43
-
44
-
45
-
46
-
47
-
48
-
49
-
50
-
51
-
52
-
53
-
54
-
55
-
56
-
57
-
58
-
59
-
60
-
61
-
62
-
63
-
64
-
65
-
66
-
67
-
68
-
69
-
70
-
71
-
72
-
73
-
74
-
75
-
76
-
77
-
78
-
79
-
80
-
81
-
82
-
83
-
84
-
85
-
86
-
87
-
88
-
89
-
90
-
91
-
92
-
93
-
94
-
95
-
96
-
97
-
98
-
99
-
100
-
101
-
102
-
103
-
104
-
105
-
106
-
107
-
108
-
109
-
110
-
 111
111 -
 112
112 -
 113
113 -
 114
114 -
 115
115 -
 116
116 -
 117
117 -
 118
118 -
 119
119 -
 120
120 -
 121
121 -
 122
122 -
 123
123 -
 124
124 -
 125
125 -
 126
126 -
 127
127 -
 128
128 -
 129
129 -
 130
130 -
 131
131 -
132
-
133
-
134
-
135
-
136
-
137
-
138
-
139
-
140
-
141
-
142
-
143
-
144
-
145
-
146
-
147
-
148
-
149
-
150
-
151
-
152
-
153
-
154
-
155
-
156
-
157
-
158
-
159
-
160
-
161
-
162
-
163
-
164
-
165
-
166
-
167
-
168
-
169
-
170
-
171
-
172
-
173
-
174
-
175
-
176
-
177
-
178
-
179
-
180
-
181
-
182
-
183
-
184
-
185
-
186
-
187
-
188
-
189
-
190
-
191
-
192
-
193
-
194
-
195
-
196
-
197
-
198
-
199
-
200
-
201
-
202
-
203
-
204
-
205
-
206
-
207
-
208
-
209
-
210
-
211
-
212
-
213
-
214
-
215
-
216
-
217
-
218
-
219
-
220
-
221
-
222
-
223
-
224
-
225
-
226
-
227
-
228
-
229
-
230
-
231
-
232
-
233
-
234
-
235
-
236
-
237
-
238
-
239
-
240
-
241
-
242
-
243
-
244
-
245
-
246
-
247
-
248
-
249
-
250
-
251
-
252
-
253
-
254
-
255
-
256
 |
 |

Bank of America 2015 119
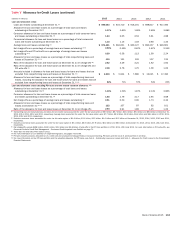
Table XI Quarterly Average Balances and Interest Rates – FTE Basis (continued)
Second Quarter 2015 First Quarter 2015 Fourth Quarter 2014
(Dollars in millions)
Average
Balance
Interest
Income/
Expense
Yield/
Rate
Average
Balance
Interest
Income/
Expense
Yield/
Rate
Average
Balance
Interest
Income/
Expense
Yield/
Rate
Earning assets
Interest-bearing deposits with the Federal Reserve, non-U.S.
central banks and other banks $ 125,762 $ 81 0.26% $ 126,189 $ 84 0.27% $ 109,042 $ 74 0.27%
Time deposits placed and other short-term investments 8,183 34 1.64 8,379 33 1.61 9,339 41 1.73
Federal funds sold and securities borrowed or purchased under
agreements to resell 214,326 268 0.50 213,931 231 0.44 217,982 237 0.43
Trading account assets 137,137 1,114 3.25 138,946 1,122 3.26 144,147 1,142 3.15
Debt securities (1) 386,357 3,082 3.21 383,120 1,898 2.01 371,014 1,687 1.82
Loans and leases (2):
Residential mortgage 207,356 1,782 3.44 215,030 1,851 3.45 223,132 1,946 3.49
Home equity 82,640 769 3.73 84,915 770 3.66 86,825 808 3.70
U.S. credit card 87,460 1,980 9.08 88,695 2,027 9.27 89,381 2,087 9.26
Non-U.S. credit card 10,012 264 10.56 10,002 262 10.64 10,950 280 10.14
Direct/Indirect consumer (3) 83,698 504 2.42 80,713 491 2.47 83,121 522 2.49
Other consumer (4) 1,885 15 3.14 1,847 15 3.29 2,031 85 16.75
Total consumer 473,051 5,314 4.50 481,202 5,416 4.54 495,440 5,728 4.60
U.S. commercial 244,540 1,705 2.80 234,907 1,645 2.84 231,215 1,648 2.83
Commercial real estate (5) 50,478 382 3.03 48,234 347 2.92 46,996 360 3.04
Commercial lease financing 24,723 180 2.92 24,495 216 3.53 24,238 199 3.28
Non-U.S. commercial 88,623 479 2.17 83,555 485 2.35 86,844 527 2.41
Total commercial 408,364 2,746 2.70 391,191 2,693 2.79 389,293 2,734 2.79
Total loans and leases 881,415 8,060 3.67 872,393 8,109 3.75 884,733 8,462 3.80
Other earning assets 62,712 721 4.60 61,441 705 4.66 65,864 739 4.46
Total earning assets (6) 1,815,892 13,360 2.95 1,804,399 12,182 2.73 1,802,121 12,382 2.73
Cash and due from banks 30,751 27,695 27,590
Other assets, less allowance for loan and lease losses 305,323 306,480 307,840
Total assets $ 2,151,966 $ 2,138,574 $ 2,137,551
Interest-bearing liabilities
U.S. interest-bearing deposits:
Savings $ 47,381 $ 2 0.02% $ 46,224 $ 2 0.02% $ 45,621 $ 1 0.01%
NOW and money market deposit accounts 536,201 71 0.05 531,827 67 0.05 515,995 76 0.06
Consumer CDs and IRAs 55,832 42 0.30 58,704 45 0.31 61,880 52 0.33
Negotiable CDs, public funds and other deposits 29,904 22 0.30 28,796 22 0.31 30,950 22 0.29
Total U.S. interest-bearing deposits 669,318 137 0.08 665,551 136 0.08 654,446 151 0.09
Non-U.S. interest-bearing deposits:
Banks located in non-U.S. countries 5,162 9 0.67 4,544 8 0.74 5,415 9 0.63
Governments and official institutions 1,239 1 0.38 1,382 1 0.21 1,647 1 0.18
Time, savings and other 55,030 69 0.51 54,276 75 0.55 57,029 76 0.53
Total non-U.S. interest-bearing deposits 61,431 79 0.52 60,202 84 0.56 64,091 86 0.53
Total interest-bearing deposits 730,749 216 0.12 725,753 220 0.12 718,537 237 0.13
Federal funds purchased, securities loaned or sold under
agreements to repurchase and short-term borrowings 252,088 686 1.09 244,134 585 0.97 251,432 615 0.97
Trading account liabilities 77,772 335 1.73 78,787 394 2.03 78,174 350 1.78
Long-term debt (7) 242,230 1,407 2.33 240,127 1,313 2.20 249,221 1,315 2.10
Total interest-bearing liabilities (6) 1,302,839 2,644 0.81 1,288,801 2,512 0.79 1,297,364 2,517 0.77
Noninterest-bearing sources:
Noninterest-bearing deposits 416,040 404,973 403,977
Other liabilities 182,033 199,056 192,756
Shareholders’ equity 251,054 245,744 243,454
Total liabilities and shareholders’ equity $ 2,151,966 $ 2,138,574 $ 2,137,551
Net interest spread 2.14% 1.94% 1.96%
Impact of noninterest-bearing sources 0.23 0.23 0.22
Net interest income/yield on earning assets $ 10,716 2.37% $ 9,670 2.17% $ 9,865 2.18%
For footnotes see page 118.