Bank of America 2015 Annual Report Download - page 137
Download and view the complete annual report
Please find page 137 of the 2015 Bank of America annual report below. You can navigate through the pages in the report by either clicking on the pages listed below, or by using the keyword search tool below to find specific information within the annual report.-
 1
1 -
2
-
3
-
4
-
5
-
6
-
7
-
8
-
9
-
10
-
11
-
12
-
13
-
14
-
15
-
16
-
17
-
18
-
19
-
20
-
21
-
22
-
23
-
24
-
25
-
26
-
27
-
28
-
29
-
30
-
31
-
32
-
33
-
34
-
35
-
36
-
37
-
38
-
39
-
40
-
41
-
42
-
43
-
44
-
45
-
46
-
47
-
48
-
49
-
50
-
51
-
52
-
53
-
54
-
55
-
56
-
57
-
58
-
59
-
60
-
61
-
62
-
63
-
64
-
65
-
66
-
67
-
68
-
69
-
70
-
71
-
72
-
73
-
74
-
75
-
76
-
77
-
78
-
79
-
80
-
81
-
82
-
83
-
84
-
85
-
86
-
87
-
88
-
89
-
90
-
91
-
92
-
93
-
94
-
95
-
96
-
97
-
98
-
99
-
100
-
101
-
102
-
103
-
104
-
105
-
106
-
107
-
108
-
109
-
110
-
111
-
112
-
113
-
114
-
115
-
116
-
117
-
118
-
119
-
120
-
121
-
122
-
123
-
124
-
125
-
126
-
 127
127 -
 128
128 -
 129
129 -
 130
130 -
 131
131 -
 132
132 -
 133
133 -
 134
134 -
 135
135 -
 136
136 -
 137
137 -
 138
138 -
 139
139 -
 140
140 -
 141
141 -
 142
142 -
 143
143 -
 144
144 -
 145
145 -
 146
146 -
 147
147 -
148
-
149
-
150
-
151
-
152
-
153
-
154
-
155
-
156
-
157
-
158
-
159
-
160
-
161
-
162
-
163
-
164
-
165
-
166
-
167
-
168
-
169
-
170
-
171
-
172
-
173
-
174
-
175
-
176
-
177
-
178
-
179
-
180
-
181
-
182
-
183
-
184
-
185
-
186
-
187
-
188
-
189
-
190
-
191
-
192
-
193
-
194
-
195
-
196
-
197
-
198
-
199
-
200
-
201
-
202
-
203
-
204
-
205
-
206
-
207
-
208
-
209
-
210
-
211
-
212
-
213
-
214
-
215
-
216
-
217
-
218
-
219
-
220
-
221
-
222
-
223
-
224
-
225
-
226
-
227
-
228
-
229
-
230
-
231
-
232
-
233
-
234
-
235
-
236
-
237
-
238
-
239
-
240
-
241
-
242
-
243
-
244
-
245
-
246
-
247
-
248
-
249
-
250
-
251
-
252
-
253
-
254
-
255
-
256
 |
 |

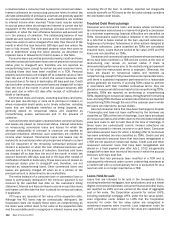
Bank of America 2015 135
Bank of America Corporation and Subsidiaries
Consolidated Statement of Cash Flows
(Dollars in millions) 2015 2014 2013
Operating activities
Net income $ 15,888 $ 4,833 $ 11,431
Adjustments to reconcile net income to net cash provided by operating activities:
Provision for credit losses 3,161 2,275 3,556
Gains on sales of debt securities (1,091)(1,354) (1,271)
Fair value adjustments on structured liabilities 633 (407) 649
Depreciation and premises improvements amortization 1,555 1,586 1,597
Amortization of intangibles 834 936 1,086
Net amortization of premium/discount on debt securities 2,472 2,688 1,577
Deferred income taxes 3,108 726 3,262
Loans held-for-sale:
Originations and purchases (38,675) (40,113) (65,688)
Proceeds from sales and paydowns of loans originally classified as held-for-sale 36,204 38,528 77,707
Net change in:
Trading and derivative instruments 3,292 6,621 33,870
Other assets 2,458 5,828 35,154
Accrued expenses and other liabilities 730 9,702 (12,919)
Other operating activities, net (2,839)(1,714) 2,806
Net cash provided by operating activities 27,730 30,135 92,817
Investing activities
Net change in:
Time deposits placed and other short-term investments 50 4,030 7,154
Federal funds sold and securities borrowed or purchased under agreements to resell (659) (1,495) 29,596
Debt securities carried at fair value:
Proceeds from sales 145,079 126,399 103,743
Proceeds from paydowns and maturities 84,988 79,704 85,554
Purchases (219,412) (247,902) (160,744)
Held-to-maturity debt securities:
Proceeds from paydowns and maturities 12,872 7,889 8,472
Purchases (36,575) (13,274) (14,388)
Loans and leases:
Proceeds from sales 22,316 28,765 12,331
Purchases (12,629) (10,609) (16,734)
Other changes in loans and leases, net (52,626) 19,239 (34,256)
Proceeds from sales of equity investments 333 1,577 4,818
Other investing activities, net 1,309 (1,923) (488)
Net cash provided by (used in) investing activities (54,954) (7,600) 25,058
Financing activities
Net change in:
Deposits 78,347 (335) 14,010
Federal funds purchased and securities loaned or sold under agreements to repurchase (26,986) 3,171 (95,153)
Short-term borrowings (3,074)(14,827) 16,009
Long-term debt:
Proceeds from issuance 43,670 51,573 45,658
Retirement of long-term debt (40,365) (53,749) (65,602)
Preferred stock:
Proceeds from issuance 2,964 5,957 1,008
Redemption —— (6,461)
Common stock repurchased (2,374)(1,675) (3,220)
Cash dividends paid (3,574)(2,306) (1,677)
Excess tax benefits on share-based payments 16 34 12
Other financing activities, net (39) (44) (26)
Net cash provided by (used in) financing activities 48,585 (12,201) (95,442)
Effect of exchange rate changes on cash and cash equivalents (597) (3,067) (1,863)
Net increase in cash and cash equivalents 20,764 7,267 20,570
Cash and cash equivalents at January 1 138,589 131,322 110,752
Cash and cash equivalents at December 31 $ 159,353 $ 138,589 $ 131,322
Supplemental cash flow disclosures
Interest paid $ 10,623 $ 11,082 $ 12,912
Income taxes paid 2,326 2,558 1,559
Income taxes refunded (151) (144) (244)
See accompanying Notes to Consolidated Financial Statements.