Bank of America 2015 Annual Report Download - page 41
Download and view the complete annual report
Please find page 41 of the 2015 Bank of America annual report below. You can navigate through the pages in the report by either clicking on the pages listed below, or by using the keyword search tool below to find specific information within the annual report.-
 1
1 -
2
-
3
-
4
-
5
-
6
-
7
-
8
-
9
-
10
-
11
-
12
-
13
-
14
-
15
-
16
-
17
-
18
-
19
-
20
-
21
-
22
-
23
-
24
-
25
-
26
-
27
-
28
-
29
-
30
-
 31
31 -
 32
32 -
 33
33 -
 34
34 -
 35
35 -
 36
36 -
 37
37 -
 38
38 -
 39
39 -
 40
40 -
 41
41 -
 42
42 -
 43
43 -
 44
44 -
 45
45 -
 46
46 -
 47
47 -
 48
48 -
 49
49 -
 50
50 -
 51
51 -
52
-
53
-
54
-
55
-
56
-
57
-
58
-
59
-
60
-
61
-
62
-
63
-
64
-
65
-
66
-
67
-
68
-
69
-
70
-
71
-
72
-
73
-
74
-
75
-
76
-
77
-
78
-
79
-
80
-
81
-
82
-
83
-
84
-
85
-
86
-
87
-
88
-
89
-
90
-
91
-
92
-
93
-
94
-
95
-
96
-
97
-
98
-
99
-
100
-
101
-
102
-
103
-
104
-
105
-
106
-
107
-
108
-
109
-
110
-
111
-
112
-
113
-
114
-
115
-
116
-
117
-
118
-
119
-
120
-
121
-
122
-
123
-
124
-
125
-
126
-
127
-
128
-
129
-
130
-
131
-
132
-
133
-
134
-
135
-
136
-
137
-
138
-
139
-
140
-
141
-
142
-
143
-
144
-
145
-
146
-
147
-
148
-
149
-
150
-
151
-
152
-
153
-
154
-
155
-
156
-
157
-
158
-
159
-
160
-
161
-
162
-
163
-
164
-
165
-
166
-
167
-
168
-
169
-
170
-
171
-
172
-
173
-
174
-
175
-
176
-
177
-
178
-
179
-
180
-
181
-
182
-
183
-
184
-
185
-
186
-
187
-
188
-
189
-
190
-
191
-
192
-
193
-
194
-
195
-
196
-
197
-
198
-
199
-
200
-
201
-
202
-
203
-
204
-
205
-
206
-
207
-
208
-
209
-
210
-
211
-
212
-
213
-
214
-
215
-
216
-
217
-
218
-
219
-
220
-
221
-
222
-
223
-
224
-
225
-
226
-
227
-
228
-
229
-
230
-
231
-
232
-
233
-
234
-
235
-
236
-
237
-
238
-
239
-
240
-
241
-
242
-
243
-
244
-
245
-
246
-
247
-
248
-
249
-
250
-
251
-
252
-
253
-
254
-
255
-
256
 |
 |

Bank of America 2015 39
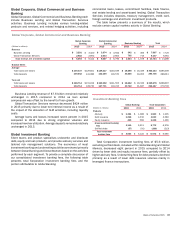
Net income for Global Markets decreased $209 million to $2.5
billion in 2015 compared to 2014. Excluding net DVA, net income
increased $128 million to $3.0 billion in 2015 compared to 2014,
primarily driven by lower noninterest expense and lower tax
expense, partially offset by lower revenue. Revenue, excluding net
DVA, decreased due to lower trading account profits due to declines
in credit-related businesses, lower investment banking fees and
lower equity investment gains (not included in sales and trading
revenue) as 2014 included gains related to the IPO of an equity
investment, partially offset by an increase in net interest income.
Net DVA losses were $786 million compared to losses of $240
million in 2014. Sales and trading revenue, excluding net DVA,
decreased $142 million due to lower fixed-income, currencies and
commodities (FICC) revenue, partially offset by increased Equities
revenue. Noninterest expense decreased $552 million to $11.3
billion largely due to lower litigation expense and, to a lesser extent,
lower revenue-related incentive compensation and support costs.
The effective tax rate for 2014 reflected the impact of non-
deductible litigation expense.
Average earning assets decreased $27.8 billion to $433.4
billion in 2015 largely driven by a decrease in reverse repurchases,
securities borrowed and trading securities primarily due to a
reduction in client financing activity and continuing balance sheet
optimization efforts across Global Markets.
Year-end loans and leases increased $13.8 billion in 2015
primarily due to growth in mortgage and securitization finance.
The return on average allocated capital was seven percent,
down from eight percent, reflecting a decrease in net income and
an increase in allocated capital.
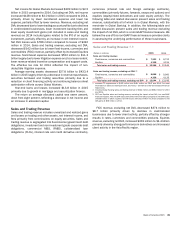
Sales and Trading Revenue
Sales and trading revenue includes unrealized and realized gains
and losses on trading and other assets, net interest income, and
fees primarily from commissions on equity securities. Sales and
trading revenue is segregated into fixed-income (government debt
obligations, investment and non-investment grade corporate debt
obligations, commercial MBS, RMBS, collateralized loan
obligations (CLOs), interest rate and credit derivative contracts),
currencies (interest rate and foreign exchange contracts),
commodities (primarily futures, forwards, swaps and options) and
equities (equity-linked derivatives and cash equity activity). The
following table and related discussion present sales and trading
revenue, substantially all of which is in Global Markets, with the
remainder in Global Banking. In addition, the following table and
related discussion present sales and trading revenue excluding
the impact of net DVA, which is a non-GAAP financial measure. We
believe the use of this non-GAAP financial measure provides clarity
in assessing the underlying performance of these businesses.
Sales and Trading Revenue (1, 2)
(Dollars in millions) 2015 2014
Sales and trading revenue
Fixed-income, currencies and commodities $ 7,923 $ 8,752
Equities 4,335 4,194
Total sales and trading revenue $ 12,258 $ 12,946
Sales and trading revenue, excluding net DVA (3)
Fixed-income, currencies and commodities $ 8,686 $ 9,060
Equities 4,358 4,126
Total sales and trading revenue, excluding net DVA $ 13,044 $ 13,186
(1) Includes FTE adjustments of $182 million and $181 million for 2015 and 2014. For more
information on sales and trading revenue, see Note 2 – Derivatives to the Consolidated Financial
Statements.
(2) Includes Global Banking sales and trading revenue of $422 million and $382 million for 2015
and 2014.
(3) FICC and Equities sales and trading revenue, excluding the impact of net DVA, is a non-GAAP
financial measure. FICC net DVA losses were $763 million for 2015 compared to net DVA losses
of $308 million in 2014. Equities net DVA losses were $23 million for 2015 compared to net
DVA gains of $68 million in 2014.
FICC revenue, excluding net DVA, decreased $374 million to
$8.7 billion primarily driven by declines in credit-related
businesses due to lower client activity, partially offset by stronger
results in rates, currencies and commodities products. Equities
revenue, excluding net DVA, increased $232 million to $4.4 billion
primarily driven by strong performance in derivatives and increased
client activity in the Asia-Pacific region.