Bank of America 2015 Annual Report Download - page 37
Download and view the complete annual report
Please find page 37 of the 2015 Bank of America annual report below. You can navigate through the pages in the report by either clicking on the pages listed below, or by using the keyword search tool below to find specific information within the annual report.-
 1
1 -
2
-
3
-
4
-
5
-
6
-
7
-
8
-
9
-
10
-
11
-
12
-
13
-
14
-
15
-
16
-
17
-
18
-
19
-
20
-
21
-
22
-
23
-
24
-
25
-
26
-
 27
27 -
 28
28 -
 29
29 -
 30
30 -
 31
31 -
 32
32 -
 33
33 -
 34
34 -
 35
35 -
 36
36 -
 37
37 -
 38
38 -
 39
39 -
 40
40 -
 41
41 -
 42
42 -
 43
43 -
 44
44 -
 45
45 -
 46
46 -
 47
47 -
48
-
49
-
50
-
51
-
52
-
53
-
54
-
55
-
56
-
57
-
58
-
59
-
60
-
61
-
62
-
63
-
64
-
65
-
66
-
67
-
68
-
69
-
70
-
71
-
72
-
73
-
74
-
75
-
76
-
77
-
78
-
79
-
80
-
81
-
82
-
83
-
84
-
85
-
86
-
87
-
88
-
89
-
90
-
91
-
92
-
93
-
94
-
95
-
96
-
97
-
98
-
99
-
100
-
101
-
102
-
103
-
104
-
105
-
106
-
107
-
108
-
109
-
110
-
111
-
112
-
113
-
114
-
115
-
116
-
117
-
118
-
119
-
120
-
121
-
122
-
123
-
124
-
125
-
126
-
127
-
128
-
129
-
130
-
131
-
132
-
133
-
134
-
135
-
136
-
137
-
138
-
139
-
140
-
141
-
142
-
143
-
144
-
145
-
146
-
147
-
148
-
149
-
150
-
151
-
152
-
153
-
154
-
155
-
156
-
157
-
158
-
159
-
160
-
161
-
162
-
163
-
164
-
165
-
166
-
167
-
168
-
169
-
170
-
171
-
172
-
173
-
174
-
175
-
176
-
177
-
178
-
179
-
180
-
181
-
182
-
183
-
184
-
185
-
186
-
187
-
188
-
189
-
190
-
191
-
192
-
193
-
194
-
195
-
196
-
197
-
198
-
199
-
200
-
201
-
202
-
203
-
204
-
205
-
206
-
207
-
208
-
209
-
210
-
211
-
212
-
213
-
214
-
215
-
216
-
217
-
218
-
219
-
220
-
221
-
222
-
223
-
224
-
225
-
226
-
227
-
228
-
229
-
230
-
231
-
232
-
233
-
234
-
235
-
236
-
237
-
238
-
239
-
240
-
241
-
242
-
243
-
244
-
245
-
246
-
247
-
248
-
249
-
250
-
251
-
252
-
253
-
254
-
255
-
256
 |
 |

Bank of America 2015 35
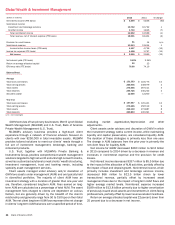
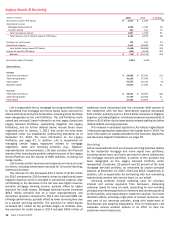
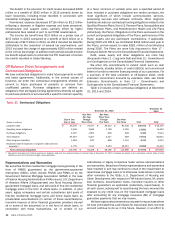
Key Indicators and Metrics
(Dollars in millions, except as noted) 2015 2014
Revenue by Business
Merrill Lynch Global Wealth Management $14,898 $ 15,256
U.S. Trust 3,027 3,084
Other (1) 76 64
Total revenue, net of interest expense (FTE basis) $ 18,001 $ 18,404
Client Balances by Business, at year end
Merrill Lynch Global Wealth Management $1,985,309 $ 2,033,801
U.S. Trust 388,604 387,491
Other (1) 82,929 76,705
Total client balances $ 2,456,842 $ 2,497,997
Client Balances by Type, at year end
Long-term assets under management $ 817,938 $ 826,171
Liquidity assets under management 82,925 76,701
Assets under management 900,863 902,872
Brokerage assets 1,040,937 1,081,434
Assets in custody 113,239 139,555
Deposits 260,893 245,391
Loans and leases (2) 140,910 128,745
Total client balances $ 2,456,842 $ 2,497,997
Assets Under Management Rollforward
Assets under management, beginning of year $ 902,872 $ 821,449
Net long-term client flows 34,441 49,800
Net liquidity client flows 6,133 3,361
Market valuation/other (42,583) 28,262
Total assets under management, end of year $ 900,863 $ 902,872
Associates, at year end (3)
Number of financial advisors 16,724 16,035
Total wealth advisors 18,167 17,231
Total client-facing professionals 20,632 19,750
Merrill Lynch Global Wealth Management Metric
Financial advisor productivity (4) (in thousands) $ 1,019 $ 1,065
U.S. Trust Metric, at year end
Client-facing professionals 2,181 2,155
(1) Includes the results of BofA Global Capital Management, the cash management division of Bank of America, and certain administrative items.
(2) Includes margin receivables which are classified in customer and other receivables on the Consolidated Balance Sheet.
(3) Includes financial advisors in the Consumer Banking segment of 2,191 and 1,950 at December 31, 2015 and 2014.
(4) Financial advisor productivity is defined as Merrill Lynch Global Wealth Management total revenue, excluding the allocation of certain ALM activities, divided by the total number of financial advisors
(excluding financial advisors in the Consumer Banking segment).
Client balances decreased $41.2 billion, or two percent, to
nearly $2.5 trillion driven by market declines, partially offset by
client balance flows.
The number of wealth advisors increased five percent, due to
continued investment in the advisor development programs,
improved competitive recruiting and near historically low advisor
attrition levels.
In 2015, revenue from MLGWM of $14.9 billion and U.S. Trust
of $3.0 billion were each down two percent primarily driven by
lower net interest income due to the impact of the allocation of
ALM activities. Additionally, noninterest income was down in
MLGWM driven by lower transactional revenue, partially offset by
the impact of long-term AUM flows.
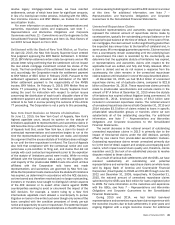
Net Migration Summary
GWIM results are impacted by the net migration of clients and their
corresponding deposit, loan and brokerage balances primarily to
or from Consumer Banking, as presented in the table below.
Migrations result from the movement of clients between business
segments to better align with client needs.
Net Migration Summary (1)
(Dollars in millions) 2015 2014
Total deposits, net – to (from) GWIM $ (218) $ 1,350
Total loans, net – to (from) GWIM (97) (61)
Total brokerage, net – to (from) GWIM (2,416) (2,710)
(1) Migration occurs primarily between GWIM and Consumer Banking.