Bank of America 2015 Annual Report Download - page 210
Download and view the complete annual report
Please find page 210 of the 2015 Bank of America annual report below. You can navigate through the pages in the report by either clicking on the pages listed below, or by using the keyword search tool below to find specific information within the annual report.-
 1
1 -
2
-
3
-
4
-
5
-
6
-
7
-
8
-
9
-
10
-
11
-
12
-
13
-
14
-
15
-
16
-
17
-
18
-
19
-
20
-
21
-
22
-
23
-
24
-
25
-
26
-
27
-
28
-
29
-
30
-
31
-
32
-
33
-
34
-
35
-
36
-
37
-
38
-
39
-
40
-
41
-
42
-
43
-
44
-
45
-
46
-
47
-
48
-
49
-
50
-
51
-
52
-
53
-
54
-
55
-
56
-
57
-
58
-
59
-
60
-
61
-
62
-
63
-
64
-
65
-
66
-
67
-
68
-
69
-
70
-
71
-
72
-
73
-
74
-
75
-
76
-
77
-
78
-
79
-
80
-
81
-
82
-
83
-
84
-
85
-
86
-
87
-
88
-
89
-
90
-
91
-
92
-
93
-
94
-
95
-
96
-
97
-
98
-
99
-
100
-
101
-
102
-
103
-
104
-
105
-
106
-
107
-
108
-
109
-
110
-
111
-
112
-
113
-
114
-
115
-
116
-
117
-
118
-
119
-
120
-
121
-
122
-
123
-
124
-
125
-
126
-
127
-
128
-
129
-
130
-
131
-
132
-
133
-
134
-
135
-
136
-
137
-
138
-
139
-
140
-
141
-
142
-
143
-
144
-
145
-
146
-
147
-
148
-
149
-
150
-
151
-
152
-
153
-
154
-
155
-
156
-
157
-
158
-
159
-
160
-
161
-
162
-
163
-
164
-
165
-
166
-
167
-
168
-
169
-
170
-
171
-
172
-
173
-
174
-
175
-
176
-
177
-
178
-
179
-
180
-
181
-
182
-
183
-
184
-
185
-
186
-
187
-
188
-
189
-
190
-
191
-
192
-
193
-
194
-
195
-
196
-
197
-
198
-
199
-
 200
200 -
 201
201 -
 202
202 -
 203
203 -
 204
204 -
 205
205 -
 206
206 -
 207
207 -
 208
208 -
 209
209 -
 210
210 -
 211
211 -
 212
212 -
 213
213 -
 214
214 -
 215
215 -
 216
216 -
 217
217 -
 218
218 -
 219
219 -
 220
220 -
221
-
222
-
223
-
224
-
225
-
226
-
227
-
228
-
229
-
230
-
231
-
232
-
233
-
234
-
235
-
236
-
237
-
238
-
239
-
240
-
241
-
242
-
243
-
244
-
245
-
246
-
247
-
248
-
249
-
250
-
251
-
252
-
253
-
254
-
255
-
256
 |
 |

208 Bank of America 2015
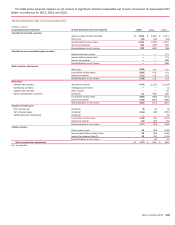
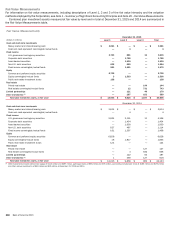
NOTE 14 Accumulated Other Comprehensive Income (Loss)
The table below presents the changes in accumulated OCI after-tax for 2013, 2014 and 2015.
(Dollars in millions)
Available-for-
Sale Debt
Securities
Available-for-
Sale Marketable
Equity Securities
Debit Valuation
Adjustments (1) Derivatives
Employee
Benefit Plans
Foreign
Currency (2) Total
Balance, December 31, 2012 $ 4,443 $ 462 n/a $ (2,869) $ (4,456) $ (377) $ (2,797)
Net change (7,700) (466) n/a 592 2,049 (135) (5,660)
Balance, December 31, 2013 $ (3,257) $ (4) n/a $ (2,277) $ (2,407) $ (512) $ (8,457)
Net change 4,600 21 n/a 616 (943) (157) 4,137
Balance, December 31, 2014 $ 1,343 $ 17 n/a $ (1,661) $ (3,350) $ (669) $ (4,320)
Cumulative adjustment for accounting change ——$ (1,226) — — — (1,226)
Net change (1,643) 45 615 584 394 (123) (128)
Balance, December 31, 2015 $ (300) $ 62 $ (611) $ (1,077)$ (2,956)$ (792) $ (5,674)
(1) For information on the impact of early adoption of new accounting guidance on recognition and measurement of financial instruments, see Note 1 – Summary of Significant Accounting Principles.
(2) The net change in fair value represents the impact of changes in spot foreign exchange rates on the Corporation’s net investment in non-U.S. operations and related hedges.
n/a = not applicable
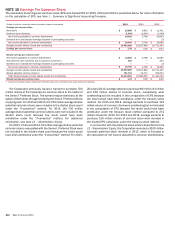
The table below presents the net change in fair value recorded in accumulated OCI, net realized gains and losses reclassified into
earnings and other changes for each component of OCI before- and after-tax for 2015, 2014 and 2013.
Changes in OCI Components Before- and After-tax
2015 2014 2013
(Dollars in millions) Before-tax Tax effect After-tax Before-tax Tax effect After-tax Before-tax Tax effect After-tax
Available-for-sale debt securities:
Net increase (decrease) in fair value $ (1,644) $ 627 $ (1,017)$ 8,698 $ (3,268) $ 5,430 $ (10,989) $ 4,077 $ (6,912)
Net realized gains reclassified into earnings (1,010) 384 (626) (1,338) 508 (830) (1,251) 463 (788)
Net change (2,654) 1,011 (1,643)7,360 (2,760) 4,600 (12,240) 4,540 (7,700)
Available-for-sale marketable equity securities:
Net increase in fair value 72 (27) 45 34 (13) 21 32 (12) 20
Net realized gains reclassified into earnings — —— — — — (771) 285 (486)
Net change 72 (27) 45 34 (13) 21 (739) 273 (466)
Debit valuation adjustments:
Net increase in fair value 436 (166) 270 n/a n/a n/a n/a n/a n/a
Net realized losses reclassified into earnings 556 (211) 345 n/a n/a n/a n/a n/a n/a
Net change 992 (377) 615 n/a n/a n/a n/a n/a n/a
Derivatives:
Net increase in fair value 55 (22) 33 195 (54) 141 156 (51) 105
Net realized losses reclassified into earnings 883 (332) 551 760 (285) 475 773 (286) 487
Net change 938 (354) 584 955 (339) 616 929 (337) 592
Employee benefit plans:
Net increase (decrease) in fair value 408 (121) 287 (1,629) 614 (1,015) 2,985 (1,128) 1,857
Net realized losses reclassified into earnings 169 (62) 107 55 (23) 32 237 (79) 158
Settlements, curtailments and other 1 (1) — (1) 41 40 46 (12) 34
Net change 578 (184) 394 (1,575) 632 (943) 3,268 (1,219) 2,049
Foreign currency:
Net decrease in fair value 600 (723) (123) 714 (879) (165) 244 (384) (140)
Net realized losses reclassified into earnings (38) 38 — 20 (12) 8 138 (133) 5
Net change 562 (685) (123) 734 (891) (157) 382 (517) (135)
Total other comprehensive income (loss) $ 488 $ (616) $ (128) $ 7,508 $ (3,371) $ 4,137 $ (8,400) $ 2,740 $ (5,660)
n/a = not applicable