Bank of America 2015 Annual Report Download - page 40
Download and view the complete annual report
Please find page 40 of the 2015 Bank of America annual report below. You can navigate through the pages in the report by either clicking on the pages listed below, or by using the keyword search tool below to find specific information within the annual report.-
 1
1 -
2
-
3
-
4
-
5
-
6
-
7
-
8
-
9
-
10
-
11
-
12
-
13
-
14
-
15
-
16
-
17
-
18
-
19
-
20
-
21
-
22
-
23
-
24
-
25
-
26
-
27
-
28
-
29
-
 30
30 -
 31
31 -
 32
32 -
 33
33 -
 34
34 -
 35
35 -
 36
36 -
 37
37 -
 38
38 -
 39
39 -
 40
40 -
 41
41 -
 42
42 -
 43
43 -
 44
44 -
 45
45 -
 46
46 -
 47
47 -
 48
48 -
 49
49 -
 50
50 -
51
-
52
-
53
-
54
-
55
-
56
-
57
-
58
-
59
-
60
-
61
-
62
-
63
-
64
-
65
-
66
-
67
-
68
-
69
-
70
-
71
-
72
-
73
-
74
-
75
-
76
-
77
-
78
-
79
-
80
-
81
-
82
-
83
-
84
-
85
-
86
-
87
-
88
-
89
-
90
-
91
-
92
-
93
-
94
-
95
-
96
-
97
-
98
-
99
-
100
-
101
-
102
-
103
-
104
-
105
-
106
-
107
-
108
-
109
-
110
-
111
-
112
-
113
-
114
-
115
-
116
-
117
-
118
-
119
-
120
-
121
-
122
-
123
-
124
-
125
-
126
-
127
-
128
-
129
-
130
-
131
-
132
-
133
-
134
-
135
-
136
-
137
-
138
-
139
-
140
-
141
-
142
-
143
-
144
-
145
-
146
-
147
-
148
-
149
-
150
-
151
-
152
-
153
-
154
-
155
-
156
-
157
-
158
-
159
-
160
-
161
-
162
-
163
-
164
-
165
-
166
-
167
-
168
-
169
-
170
-
171
-
172
-
173
-
174
-
175
-
176
-
177
-
178
-
179
-
180
-
181
-
182
-
183
-
184
-
185
-
186
-
187
-
188
-
189
-
190
-
191
-
192
-
193
-
194
-
195
-
196
-
197
-
198
-
199
-
200
-
201
-
202
-
203
-
204
-
205
-
206
-
207
-
208
-
209
-
210
-
211
-
212
-
213
-
214
-
215
-
216
-
217
-
218
-
219
-
220
-
221
-
222
-
223
-
224
-
225
-
226
-
227
-
228
-
229
-
230
-
231
-
232
-
233
-
234
-
235
-
236
-
237
-
238
-
239
-
240
-
241
-
242
-
243
-
244
-
245
-
246
-
247
-
248
-
249
-
250
-
251
-
252
-
253
-
254
-
255
-
256
 |
 |

38 Bank of America 2015
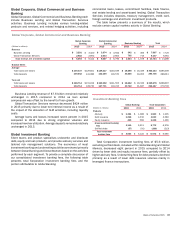
Global Markets
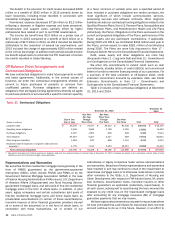
(Dollars in millions) 2015 2014 % Change
Net interest income (FTE basis) $ 4,338 $ 4,004 8%
Noninterest income:
Investment and brokerage services 2,221 2,205 1
Investment banking fees 2,401 2,743 (12)
Trading account profits 6,070 5,997 1
All other income 37 1,239 (97)
Total noninterest income 10,729 12,184 (12)
Total revenue, net of interest expense (FTE basis) 15,067 16,188 (7)
Provision for credit losses 99 110 (10)
Noninterest expense 11,310 11,862 (5)
Income before income taxes (FTE basis) 3,658 4,216 (13)
Income tax expense (FTE basis) 1,162 1,511 (23)
Net income $ 2,496 $ 2,705 (8)
Return on average allocated capital 7% 8%
Efficiency ratio (FTE basis) 75.06 73.28
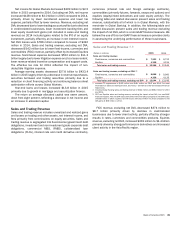
Balance Sheet
Average
Trading-related assets:
Trading account securities $ 195,731 $ 201,956 (3)
Reverse repurchases 103,690 116,085 (11)
Securities borrowed 79,494 85,098 (7)
Derivative assets 54,520 46,676 17
Total trading-related assets (1) 433,435 449,815 (4)
Total loans and leases 63,572 62,073 2
Total earning assets (1) 433,372 461,189 (6)
Total assets 596,849 607,623 (2)
Total deposits 38,470 40,813 (6)
Allocated capital 35,000 34,000 3
Year end
Total trading-related assets (1) $ 374,081 $ 418,860 (11)
Total loans and leases 73,208 59,388 23
Total earning assets (1) 386,857 421,799 (8)
Total assets 551,587 579,594 (5)
Total deposits 37,276 40,746 (9)
(1) Trading-related assets include derivative assets, which are considered non-earning assets.
Global Markets offers sales and trading services, including
research, to institutional clients across fixed-income, credit,
currency, commodity and equity businesses. Global Markets
product coverage includes securities and derivative products in
both the primary and secondary markets. Global Markets provides
market-making, financing, securities clearing, settlement and
custody services globally to our institutional investor clients in
support of their investing and trading activities. We also work with
our commercial and corporate clients to provide risk management
products using interest rate, equity, credit, currency and commodity
derivatives, foreign exchange, fixed-income and mortgage-related
products. As a result of our market-making activities in these
products, we may be required to manage risk in a broad range of
financial products including government securities, equity and
equity-linked securities, high-grade and high-yield corporate debt
securities, syndicated loans, MBS, commodities and asset-backed
securities (ABS). The economics of most investment banking and
underwriting activities are shared primarily between Global Markets
and Global Banking based on the activities performed by each
segment. Global Banking originates certain deal-related
transactions with our corporate and commercial clients that are
executed and distributed by Global Markets. For information on
investment banking fees on a consolidated basis, see page 37.
Retrospective to January 1, 2015, we early adopted new
accounting guidance that requires the Corporation to present
unrealized DVA gains and losses on certain liabilities accounted
for under the fair value option in accumulated OCI. This change,
which is reflected entirely in Global Markets, resulted in a
reclassification of pretax unrealized DVA gains of $1.0 billion from
other income to accumulated OCI for 2015. Results for 2014 were
not subject to restatement under the provisions of the new
accounting guidance. Net DVA on derivatives is still reported in
Global Markets segment results. For additional information, see
Executive Summary – Recent Events on page 20. In 2014, we
implemented a funding valuation adjustment (FVA) into our
valuation estimates primarily to include funding costs on
uncollateralized derivatives and derivatives where we are not
permitted to use the collateral we receive. This change in estimate
resulted in a net FVA pretax charge of $497 million in 2014, which
is included in net DVA.