Bank of America 2015 Annual Report Download - page 232
Download and view the complete annual report
Please find page 232 of the 2015 Bank of America annual report below. You can navigate through the pages in the report by either clicking on the pages listed below, or by using the keyword search tool below to find specific information within the annual report.-
 1
1 -
2
-
3
-
4
-
5
-
6
-
7
-
8
-
9
-
10
-
11
-
12
-
13
-
14
-
15
-
16
-
17
-
18
-
19
-
20
-
21
-
22
-
23
-
24
-
25
-
26
-
27
-
28
-
29
-
30
-
31
-
32
-
33
-
34
-
35
-
36
-
37
-
38
-
39
-
40
-
41
-
42
-
43
-
44
-
45
-
46
-
47
-
48
-
49
-
50
-
51
-
52
-
53
-
54
-
55
-
56
-
57
-
58
-
59
-
60
-
61
-
62
-
63
-
64
-
65
-
66
-
67
-
68
-
69
-
70
-
71
-
72
-
73
-
74
-
75
-
76
-
77
-
78
-
79
-
80
-
81
-
82
-
83
-
84
-
85
-
86
-
87
-
88
-
89
-
90
-
91
-
92
-
93
-
94
-
95
-
96
-
97
-
98
-
99
-
100
-
101
-
102
-
103
-
104
-
105
-
106
-
107
-
108
-
109
-
110
-
111
-
112
-
113
-
114
-
115
-
116
-
117
-
118
-
119
-
120
-
121
-
122
-
123
-
124
-
125
-
126
-
127
-
128
-
129
-
130
-
131
-
132
-
133
-
134
-
135
-
136
-
137
-
138
-
139
-
140
-
141
-
142
-
143
-
144
-
145
-
146
-
147
-
148
-
149
-
150
-
151
-
152
-
153
-
154
-
155
-
156
-
157
-
158
-
159
-
160
-
161
-
162
-
163
-
164
-
165
-
166
-
167
-
168
-
169
-
170
-
171
-
172
-
173
-
174
-
175
-
176
-
177
-
178
-
179
-
180
-
181
-
182
-
183
-
184
-
185
-
186
-
187
-
188
-
189
-
190
-
191
-
192
-
193
-
194
-
195
-
196
-
197
-
198
-
199
-
200
-
201
-
202
-
203
-
204
-
205
-
206
-
207
-
208
-
209
-
210
-
211
-
212
-
213
-
214
-
215
-
216
-
217
-
218
-
219
-
220
-
221
-
 222
222 -
 223
223 -
 224
224 -
 225
225 -
 226
226 -
 227
227 -
 228
228 -
 229
229 -
 230
230 -
 231
231 -
 232
232 -
 233
233 -
 234
234 -
 235
235 -
 236
236 -
 237
237 -
 238
238 -
 239
239 -
 240
240 -
 241
241 -
 242
242 -
243
-
244
-
245
-
246
-
247
-
248
-
249
-
250
-
251
-
252
-
253
-
254
-
255
-
256
 |
 |

230 Bank of America 2015
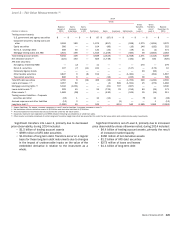
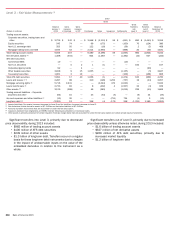
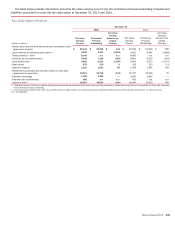
Level 3 – Fair Value Measurements (1)
2013
Gross
(Dollars in millions)
Balance
January 1
2013
Gains
(Losses)
in Earnings
Gains
(Losses)
in OCI Purchases Sales Issuances Settlements
Gross
Transfers
into
Level 3
Gross
Transfers
out of
Level 3
Balance
December 31
2013
Trading account assets:
Corporate securities, trading loans and
other $ 3,726 $ 242 $ — $ 3,848 $ (3,110) $ 59 $ (651) $ 890 $ (1,445) $ 3,559
Equity securities 545 74 — 96 (175) — (100) 70 (124) 386
Non-U.S. sovereign debt 353 50 — 122 (18) — (36) 2 (5) 468
Mortgage trading loans and ABS 4,935 53 — 2,514 (1,993) — (868) 20 (30) 4,631
Total trading account assets 9,559 419 — 6,580 (5,296) 59 (1,655) 982 (1,604) 9,044
Net derivative assets (2) 1,468 (304) — 824 (1,467) — (1,362) (10) 627 (224)
AFS debt securities:
Commercial MBS 10 — — — — — (10) — — —
Non-U.S. securities — 52 1(1) — — 100 — 107
Corporate/Agency bonds 92 — 4 — — — — — (96) —
Other taxable securities 3,928 9 15 1,055 — — (1,155) — (5) 3,847
Tax-exempt securities 1,061 3 19 — — — (109) — (168) 806
Total AFS debt securities 5,091 17 40 1,056 (1) — (1,274) 100 (269) 4,760
Loans and leases (3, 4) 2,287 98 — 310 (128) 1,252 (757) 19 (24) 3,057
Mortgage servicing rights (4) 5,716 1,941 — — (2,044) 472 (1,043) — — 5,042
Loans held-for-sale (3) 2,733 62 — 8 (402) 4 (1,507) 34 (3) 929
Other assets (5) 3,129 (288) — 46 (383) — (1,019) 239 (55) 1,669
Trading account liabilities – Corporate
securities and other (64) 10 — 43 (54) (5) — (9) 44 (35)
Accrued expenses and other liabilities (3) (15) 30 — — — (751) 724 (1) 3 (10)
Long-term debt (3) (2,301) 13 — 358 (4) (172) 258 (1,331) 1,189 (1,990)
(1) Assets (liabilities). For assets, increase (decrease) to Level 3 and for liabilities, (increase) decrease to Level 3.
(2) Net derivatives include derivative assets of $7.3 billion and derivative liabilities of $7.5 billion.
(3) Amounts represent instruments that are accounted for under the fair value option.
(4) Issuances represent loan originations and MSRs retained following securitizations or whole-loan sales.
(5) Other assets is primarily comprised of certain long-term fixed-rate margin loans that are accounted for under the fair value option and certain private equity investments.
Significant transfers into Level 3, primarily due to decreased
price observability, during 2013 included:
$982 million of trading account assets
$100 million of AFS debt securities
$239 million of other assets
$1.3 billion of long-term debt. Transfers occur on a regular
basis for these long-term debt instruments due to changes
in the impact of unobservable inputs on the value of the
embedded derivative in relation to the instrument as a
whole.
Significant transfers out of Level 3, primarily due to increased
price observability unless otherwise noted, during 2013 included:
$1.6 billion of trading account assets
$627 million of net derivative assets
$269 million of AFS debt securities, primarily due to
increased market liquidity
$1.2 billion of long-term debt