Bank of America 2015 Annual Report Download - page 235
Download and view the complete annual report
Please find page 235 of the 2015 Bank of America annual report below. You can navigate through the pages in the report by either clicking on the pages listed below, or by using the keyword search tool below to find specific information within the annual report.-
 1
1 -
2
-
3
-
4
-
5
-
6
-
7
-
8
-
9
-
10
-
11
-
12
-
13
-
14
-
15
-
16
-
17
-
18
-
19
-
20
-
21
-
22
-
23
-
24
-
25
-
26
-
27
-
28
-
29
-
30
-
31
-
32
-
33
-
34
-
35
-
36
-
37
-
38
-
39
-
40
-
41
-
42
-
43
-
44
-
45
-
46
-
47
-
48
-
49
-
50
-
51
-
52
-
53
-
54
-
55
-
56
-
57
-
58
-
59
-
60
-
61
-
62
-
63
-
64
-
65
-
66
-
67
-
68
-
69
-
70
-
71
-
72
-
73
-
74
-
75
-
76
-
77
-
78
-
79
-
80
-
81
-
82
-
83
-
84
-
85
-
86
-
87
-
88
-
89
-
90
-
91
-
92
-
93
-
94
-
95
-
96
-
97
-
98
-
99
-
100
-
101
-
102
-
103
-
104
-
105
-
106
-
107
-
108
-
109
-
110
-
111
-
112
-
113
-
114
-
115
-
116
-
117
-
118
-
119
-
120
-
121
-
122
-
123
-
124
-
125
-
126
-
127
-
128
-
129
-
130
-
131
-
132
-
133
-
134
-
135
-
136
-
137
-
138
-
139
-
140
-
141
-
142
-
143
-
144
-
145
-
146
-
147
-
148
-
149
-
150
-
151
-
152
-
153
-
154
-
155
-
156
-
157
-
158
-
159
-
160
-
161
-
162
-
163
-
164
-
165
-
166
-
167
-
168
-
169
-
170
-
171
-
172
-
173
-
174
-
175
-
176
-
177
-
178
-
179
-
180
-
181
-
182
-
183
-
184
-
185
-
186
-
187
-
188
-
189
-
190
-
191
-
192
-
193
-
194
-
195
-
196
-
197
-
198
-
199
-
200
-
201
-
202
-
203
-
204
-
205
-
206
-
207
-
208
-
209
-
210
-
211
-
212
-
213
-
214
-
215
-
216
-
217
-
218
-
219
-
220
-
221
-
222
-
223
-
224
-
 225
225 -
 226
226 -
 227
227 -
 228
228 -
 229
229 -
 230
230 -
 231
231 -
 232
232 -
 233
233 -
 234
234 -
 235
235 -
 236
236 -
 237
237 -
 238
238 -
 239
239 -
 240
240 -
 241
241 -
 242
242 -
 243
243 -
 244
244 -
 245
245 -
246
-
247
-
248
-
249
-
250
-
251
-
252
-
253
-
254
-
255
-
256
 |
 |

Bank of America 2015 233
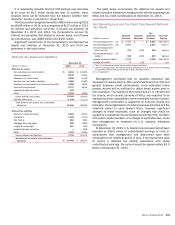
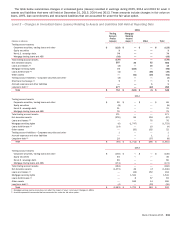
The table below summarizes changes in unrealized gains (losses) recorded in earnings during 2015, 2014 and 2013 for Level 3
assets and liabilities that were still held at December 31, 2015, 2014 and 2013. These amounts include changes in fair value on
loans, LHFS, loan commitments and structured liabilities that are accounted for under the fair value option.
Level 3 – Changes in Unrealized Gains (Losses) Relating to Assets and Liabilities Still Held at Reporting Date
2015
(Dollars in millions)
Trading
Account
Profits
(Losses)
Mortgage
Banking
Income
(Loss) (1) Other Total
Trading account assets:
Corporate securities, trading loans and other $ (123) $ — $ —$ (123)
Equity securities 3 — —3
Non-U.S. sovereign debt 74 — —74
Mortgage trading loans and ABS (93) — —(93)
Total trading account assets (139) — —(139)
Net derivative assets 507 36 62 605
Loans and leases (2) (3) — 16 13
Mortgage servicing rights 73 (158) —(85)
Loans held-for-sale (2) (1) — (38) (39)
Other assets — (41) (20) (61)
Trading account liabilities – Corporate securities and other (3) — —(3)
Short-term borrowings (2) 1 — —1
Accrued expenses and other liabilities — — 1 1
Long-term debt (2) 277 — (22) 255
Total $ 712 $ (163) $ (1) $ 548
2014
Trading account assets:
Corporate securities, trading loans and other $ 69 $ — $ — $ 69
Equity securities (8) — — (8)
Non-U.S. sovereign debt 31 — — 31
Mortgage trading loans and ABS 79 — — 79
Total trading account assets 171 — — 171
Net derivative assets (276) 85 104 (87)
Loans and leases (2) — — 76 76
Mortgage servicing rights (6) (1,747) — (1,753)
Loans held-for-sale (2) (14) — 10 (4)
Other assets — (50) 102 52
Trading account liabilities – Corporate securities and other 1 — — 1
Accrued expenses and other liabilities — — 1 1
Long-term debt (2) 29 — (37) (8)
Total $ (95) $ (1,712) $ 256 $ (1,551)
2013
Trading account assets:
Corporate securities, trading loans and other $ (130) $ — $ — $ (130)
Equity securities 40 — — 40
Non-U.S. sovereign debt 80 — — 80
Mortgage trading loans and ABS (174) — — (174)
Total trading account assets (184) — — (184)
Net derivative assets (1,375) 42 (7) (1,340)
Loans and leases (2) — (34) 152 118
Mortgage servicing rights — 1,541 — 1,541
Loans held-for-sale (2) — 6 57 63
Other assets — 166 14 180
Long-term debt (2) (4) — (32) (36)
Total $ (1,563) $ 1,721 $ 184 $ 342
(1) Mortgage banking income (loss) does not reflect the impact of Level 1 and Level 2 hedges on MSRs.
(2) Amounts represent instruments that are accounted for under the fair value option.