Bank of America 2015 Annual Report Download - page 225
Download and view the complete annual report
Please find page 225 of the 2015 Bank of America annual report below. You can navigate through the pages in the report by either clicking on the pages listed below, or by using the keyword search tool below to find specific information within the annual report.-
 1
1 -
2
-
3
-
4
-
5
-
6
-
7
-
8
-
9
-
10
-
11
-
12
-
13
-
14
-
15
-
16
-
17
-
18
-
19
-
20
-
21
-
22
-
23
-
24
-
25
-
26
-
27
-
28
-
29
-
30
-
31
-
32
-
33
-
34
-
35
-
36
-
37
-
38
-
39
-
40
-
41
-
42
-
43
-
44
-
45
-
46
-
47
-
48
-
49
-
50
-
51
-
52
-
53
-
54
-
55
-
56
-
57
-
58
-
59
-
60
-
61
-
62
-
63
-
64
-
65
-
66
-
67
-
68
-
69
-
70
-
71
-
72
-
73
-
74
-
75
-
76
-
77
-
78
-
79
-
80
-
81
-
82
-
83
-
84
-
85
-
86
-
87
-
88
-
89
-
90
-
91
-
92
-
93
-
94
-
95
-
96
-
97
-
98
-
99
-
100
-
101
-
102
-
103
-
104
-
105
-
106
-
107
-
108
-
109
-
110
-
111
-
112
-
113
-
114
-
115
-
116
-
117
-
118
-
119
-
120
-
121
-
122
-
123
-
124
-
125
-
126
-
127
-
128
-
129
-
130
-
131
-
132
-
133
-
134
-
135
-
136
-
137
-
138
-
139
-
140
-
141
-
142
-
143
-
144
-
145
-
146
-
147
-
148
-
149
-
150
-
151
-
152
-
153
-
154
-
155
-
156
-
157
-
158
-
159
-
160
-
161
-
162
-
163
-
164
-
165
-
166
-
167
-
168
-
169
-
170
-
171
-
172
-
173
-
174
-
175
-
176
-
177
-
178
-
179
-
180
-
181
-
182
-
183
-
184
-
185
-
186
-
187
-
188
-
189
-
190
-
191
-
192
-
193
-
194
-
195
-
196
-
197
-
198
-
199
-
200
-
201
-
202
-
203
-
204
-
205
-
206
-
207
-
208
-
209
-
210
-
211
-
212
-
213
-
214
-
 215
215 -
 216
216 -
 217
217 -
 218
218 -
 219
219 -
 220
220 -
 221
221 -
 222
222 -
 223
223 -
 224
224 -
 225
225 -
 226
226 -
 227
227 -
 228
228 -
 229
229 -
 230
230 -
 231
231 -
 232
232 -
 233
233 -
 234
234 -
 235
235 -
236
-
237
-
238
-
239
-
240
-
241
-
242
-
243
-
244
-
245
-
246
-
247
-
248
-
249
-
250
-
251
-
252
-
253
-
254
-
255
-
256
 |
 |

Bank of America 2015 223
It is reasonably possible that the UTB balance may decrease
by as much as $0.1 billion during the next 12 months, since
resolved items will be removed from the balance whether their
resolution results in payment or recognition.
The Corporation recognized benefits of $82 million during 2015
and $196 million in 2014, and an expense of $127 million in 2013
for interest and penalties, net-of-tax, in income tax expense. At
December 31, 2015 and 2014, the Corporation’s accrual for
interest and penalties that related to income taxes, net of taxes
and remittances, was $288 million and $455 million.
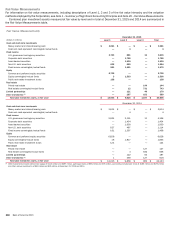
Significant components of the Corporation’s net deferred tax
assets and liabilities at December 31, 2015 and 2014 are
presented in the table below.
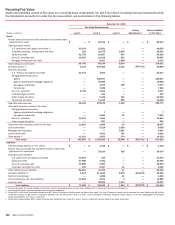
Deferred Tax Assets and Liabilities
December 31
(Dollars in millions) 2015 2014
Deferred tax assets
Net operating loss carryforwards $ 9,494 $ 10,955
Accrued expenses 6,340 6,309
Allowance for credit losses 4,649 5,478
Security, loan and debt valuations 4,084 5,385
Employee compensation and retirement benefits 3,585 3,899
Tax credit carryforwards 2,707 5,614
Available-for-sale securities 152 —
Other 2,333 1,800
Gross deferred tax assets 33,344 39,440
Valuation allowance (1,149) (1,111)
Total deferred tax assets, net of valuation
allowance 32,195 38,329
Deferred tax liabilities
Equipment lease financing 3,016 3,105
Intangibles 1,306 1,513
Fee income 864 881
Mortgage servicing rights 466 1,094
Long-term borrowings 327 630
Available-for-sale securities —828
Other 1,752 2,024
Gross deferred tax liabilities 7,731 10,075
Net deferred tax assets, net of valuation
allowance $ 24,464 $ 28,254
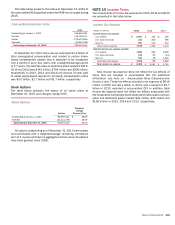
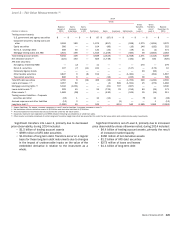
The table below summarizes the deferred tax assets and
related valuation allowances recognized for the net operating loss
(NOL) and tax credit carryforwards at December 31, 2015.
Net Operating Loss and Tax Credit Carryforward Deferred
Tax Assets
(Dollars in millions)
Deferred
Tax Asset
Valuation
Allowance
Net
Deferred
Tax Asset
First Year
Expiring
Net operating losses – U.S. $ 2,507 $ — $ 2,507 After 2027
Net operating losses – U.K. 5,657 — 5,657 None (1)
Net operating losses –
other non-U.S. 432 (323) 109 Various
Net operating losses – U.S.
states (2) 898 (405) 493 Various
General business credits 2,635 — 2,635 After 2031
Foreign tax credits 72 (72) —n/a
(1) The U.K. net operating losses may be carried forward indefinitely.
(2) The net operating losses and related valuation allowances for U.S. states before considering
the benefit of federal deductions were $1.4 billion and $623 million.
n/a = not applicable
Management concluded that no valuation allowance was
necessary to reduce the U.K. NOL carryforwards and U.S. NOL and
general business credit carryforwards since estimated future
taxable income will be sufficient to utilize these assets prior to
their expiration. The majority of the Corporation’s U.K. net deferred
tax assets, which consist primarily of NOLs, are expected to be
realized by certain subsidiaries over an extended number of years.
Management’s conclusion is supported by financial results and
forecasts, the reorganization of certain business activities and the
indefinite period to carry forward NOLs. However, significant
changes to those estimates, such as changes that would be
caused by a substantial and prolonged worsening of the condition
of Europe’s capital markets, or a change in applicable laws, could
lead management to reassess its U.K. valuation allowance
conclusions.
At December 31, 2015, U.S. federal income taxes had not been
provided on $18.0 billion of undistributed earnings of non-U.S.
subsidiaries that management has determined have been
reinvested for an indefinite period of time. If the Corporation were
to record a deferred tax liability associated with these
undistributed earnings, the amount would be approximately $5.0
billion at December 31, 2015.