Bank of America 2015 Annual Report Download - page 118
Download and view the complete annual report
Please find page 118 of the 2015 Bank of America annual report below. You can navigate through the pages in the report by either clicking on the pages listed below, or by using the keyword search tool below to find specific information within the annual report.-
 1
1 -
2
-
3
-
4
-
5
-
6
-
7
-
8
-
9
-
10
-
11
-
12
-
13
-
14
-
15
-
16
-
17
-
18
-
19
-
20
-
21
-
22
-
23
-
24
-
25
-
26
-
27
-
28
-
29
-
30
-
31
-
32
-
33
-
34
-
35
-
36
-
37
-
38
-
39
-
40
-
41
-
42
-
43
-
44
-
45
-
46
-
47
-
48
-
49
-
50
-
51
-
52
-
53
-
54
-
55
-
56
-
57
-
58
-
59
-
60
-
61
-
62
-
63
-
64
-
65
-
66
-
67
-
68
-
69
-
70
-
71
-
72
-
73
-
74
-
75
-
76
-
77
-
78
-
79
-
80
-
81
-
82
-
83
-
84
-
85
-
86
-
87
-
88
-
89
-
90
-
91
-
92
-
93
-
94
-
95
-
96
-
97
-
98
-
99
-
100
-
101
-
102
-
103
-
104
-
105
-
106
-
107
-
 108
108 -
 109
109 -
 110
110 -
 111
111 -
 112
112 -
 113
113 -
 114
114 -
 115
115 -
 116
116 -
 117
117 -
 118
118 -
 119
119 -
 120
120 -
 121
121 -
 122
122 -
 123
123 -
 124
124 -
 125
125 -
 126
126 -
 127
127 -
 128
128 -
129
-
130
-
131
-
132
-
133
-
134
-
135
-
136
-
137
-
138
-
139
-
140
-
141
-
142
-
143
-
144
-
145
-
146
-
147
-
148
-
149
-
150
-
151
-
152
-
153
-
154
-
155
-
156
-
157
-
158
-
159
-
160
-
161
-
162
-
163
-
164
-
165
-
166
-
167
-
168
-
169
-
170
-
171
-
172
-
173
-
174
-
175
-
176
-
177
-
178
-
179
-
180
-
181
-
182
-
183
-
184
-
185
-
186
-
187
-
188
-
189
-
190
-
191
-
192
-
193
-
194
-
195
-
196
-
197
-
198
-
199
-
200
-
201
-
202
-
203
-
204
-
205
-
206
-
207
-
208
-
209
-
210
-
211
-
212
-
213
-
214
-
215
-
216
-
217
-
218
-
219
-
220
-
221
-
222
-
223
-
224
-
225
-
226
-
227
-
228
-
229
-
230
-
231
-
232
-
233
-
234
-
235
-
236
-
237
-
238
-
239
-
240
-
241
-
242
-
243
-
244
-
245
-
246
-
247
-
248
-
249
-
250
-
251
-
252
-
253
-
254
-
255
-
256
 |
 |

116 Bank of America 2015
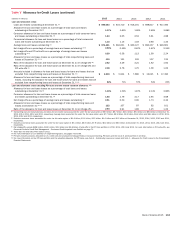
Table X Selected Quarterly Financial Data
2015 Quarters (1) 2014 Quarters
(In millions, except per share information) Fourth Third Second First Fourth Third Second First
Income statement
Net interest income $ 9,801 $ 9,511 $ 10,488 $ 9,451 $ 9,635 $ 10,219 $ 10,013 $ 10,085
Noninterest income 9,727 10,870 11,328 11,331 9,090 10,990 11,734 12,481
Total revenue, net of interest expense 19,528 20,381 21,816 20,782 18,725 21,209 21,747 22,566
Provision for credit losses 810 806 780 765 219 636 411 1,009
Noninterest expense 13,871 13,808 13,818 15,695 14,196 20,142 18,541 22,238
Income (loss) before income taxes 4,847 5,767 7,218 4,322 4,310 431 2,795 (681)
Income tax expense (benefit) 1,511 1,446 2,084 1,225 1,260 663 504 (405)
Net income (loss) 3,336 4,321 5,134 3,097 3,050 (232) 2,291 (276)
Net income (loss) applicable to common shareholders 3,006 3,880 4,804 2,715 2,738 (470) 2,035 (514)
Average common shares issued and outstanding 10,399 10,444 10,488 10,519 10,516 10,516 10,519 10,561
Average diluted common shares issued and outstanding (2) 11,153 11,197 11,238 11,267 11,274 10,516 11,265 10,561
Performance ratios
Return on average assets 0.61% 0.79% 0.96% 0.59% 0.57% n/m 0.42% n/m
Four quarter trailing return on average assets (3) 0.74 0.73 0.52 0.38 0.23 0.24% 0.37 0.45%
Return on average common shareholders’ equity 5.08 6.65 8.42 4.88 4.84 n/m 3.68 n/m
Return on average tangible common shareholders’ equity (4) 7.32 9.65 12.31 7.19 7.15 n/m 5.47 n/m
Return on average tangible shareholders’ equity (4) 7.15 9.43 11.51 7.24 7.08 n/m 5.64 n/m
Total ending equity to total ending assets 11.95 11.89 11.71 11.67 11.57 11.24 10.94 10.79
Total average equity to total average assets 11.79 11.71 11.67 11.49 11.39 11.14 10.87 11.06
Dividend payout 17.27 13.43 10.90 19.38 19.21 n/m 5.16 n/m
Per common share data
Earnings (loss) $ 0.29 $ 0.37 $ 0.46 $ 0.26 $ 0.26 $ (0.04) $ 0.19 $ (0.05)
Diluted earnings (loss) (2) 0.28 0.35 0.43 0.25 0.25 (0.04) 0.19 (0.05)
Dividends paid 0.05 0.05 0.05 0.05 0.05 0.05 0.01 0.01
Book value 22.54 22.41 21.91 21.66 21.32 20.99 21.16 20.75
Tangible book value (4) 15.62 15.50 15.02 14.79 14.43 14.09 14.24 13.81
Market price per share of common stock
Closing $ 16.83 $ 15.58 $ 17.02 $ 15.39 $ 17.89 $ 17.05 $ 15.37 $ 17.20
High closing 17.95 18.45 17.67 17.90 18.13 17.18 17.34 17.92
Low closing 15.38 15.26 15.41 15.15 15.76 14.98 14.51 16.10
Market capitalization $ 174,700 $ 162,457 $ 178,231 $ 161,909 $ 188,141 $ 179,296 $ 161,628 $ 181,117
(1) The results for 2015 were impacted by the early adoption of new accounting guidance on recognition and measurement of financial instruments. For additional information, see Executive Summary
– Recent Events on page 20.
(2) The diluted earnings (loss) per common share excluded the effect of any equity instruments that are antidilutive to earnings per share. There were no potential common shares that were dilutive in
the third and first quarters of 2014 because of the net loss applicable to common shareholders.
(3) Calculated as total net income (loss) for four consecutive quarters divided by annualized average assets for four consecutive quarters.
(4) Tangible equity ratios and tangible book value per share of common stock are non-GAAP financial measures. Other companies may define or calculate these measures differently. For more information
on these ratios, see Supplemental Financial Data on page 28, and for corresponding reconciliations to GAAP financial measures, see Statistical Table XV.
(5) For more information on the impact of the PCI loan portfolio on asset quality, see Consumer Portfolio Credit Risk Management on page 64.
(6) Includes the allowance for loan and lease losses and the reserve for unfunded lending commitments.
(7) Balances and ratios do not include loans accounted for under the fair value option. For additional exclusions from nonperforming loans, leases and foreclosed properties, see Consumer Portfolio
Credit Risk Management – Nonperforming Consumer Loans, Leases and Foreclosed Properties Activity on page 73 and corresponding Table 35, and Commercial Portfolio Credit Risk Management –
Nonperforming Commercial Loans, Leases and Foreclosed Properties Activity on page 80 and corresponding Table 44.
(8) Primarily includes amounts allocated to the U.S. credit card and unsecured consumer lending portfolios in Consumer Banking, PCI loans and the non-U.S. credit card portfolio in All Other.
(9) Net charge-offs exclude $82 million, $148 million, $290 million and $288 million of write-offs in the PCI loan portfolio in the fourth, third, second and first quarters of 2015, respectively, and $13
million, $246 million, $160 million and $391 million in the fourth, third, second and first quarters of 2014, respectively. For more information on PCI write-offs, see Consumer Portfolio Credit Risk
Management – Purchased Credit-impaired Loan Portfolio on page 71.
(10) Capital ratios reported under Advanced approaches in the fourth quarter of 2015. Prior to fourth quarter of 2015, we were required to report regulatory capital ratios under the Standardized approach
only. For additional information, see Capital Management on page 51.
n/m = not meaningful