Bank of America 2015 Annual Report Download - page 44
Download and view the complete annual report
Please find page 44 of the 2015 Bank of America annual report below. You can navigate through the pages in the report by either clicking on the pages listed below, or by using the keyword search tool below to find specific information within the annual report.-
 1
1 -
2
-
3
-
4
-
5
-
6
-
7
-
8
-
9
-
10
-
11
-
12
-
13
-
14
-
15
-
16
-
17
-
18
-
19
-
20
-
21
-
22
-
23
-
24
-
25
-
26
-
27
-
28
-
29
-
30
-
31
-
32
-
33
-
 34
34 -
 35
35 -
 36
36 -
 37
37 -
 38
38 -
 39
39 -
 40
40 -
 41
41 -
 42
42 -
 43
43 -
 44
44 -
 45
45 -
 46
46 -
 47
47 -
 48
48 -
 49
49 -
 50
50 -
 51
51 -
 52
52 -
 53
53 -
 54
54 -
55
-
56
-
57
-
58
-
59
-
60
-
61
-
62
-
63
-
64
-
65
-
66
-
67
-
68
-
69
-
70
-
71
-
72
-
73
-
74
-
75
-
76
-
77
-
78
-
79
-
80
-
81
-
82
-
83
-
84
-
85
-
86
-
87
-
88
-
89
-
90
-
91
-
92
-
93
-
94
-
95
-
96
-
97
-
98
-
99
-
100
-
101
-
102
-
103
-
104
-
105
-
106
-
107
-
108
-
109
-
110
-
111
-
112
-
113
-
114
-
115
-
116
-
117
-
118
-
119
-
120
-
121
-
122
-
123
-
124
-
125
-
126
-
127
-
128
-
129
-
130
-
131
-
132
-
133
-
134
-
135
-
136
-
137
-
138
-
139
-
140
-
141
-
142
-
143
-
144
-
145
-
146
-
147
-
148
-
149
-
150
-
151
-
152
-
153
-
154
-
155
-
156
-
157
-
158
-
159
-
160
-
161
-
162
-
163
-
164
-
165
-
166
-
167
-
168
-
169
-
170
-
171
-
172
-
173
-
174
-
175
-
176
-
177
-
178
-
179
-
180
-
181
-
182
-
183
-
184
-
185
-
186
-
187
-
188
-
189
-
190
-
191
-
192
-
193
-
194
-
195
-
196
-
197
-
198
-
199
-
200
-
201
-
202
-
203
-
204
-
205
-
206
-
207
-
208
-
209
-
210
-
211
-
212
-
213
-
214
-
215
-
216
-
217
-
218
-
219
-
220
-
221
-
222
-
223
-
224
-
225
-
226
-
227
-
228
-
229
-
230
-
231
-
232
-
233
-
234
-
235
-
236
-
237
-
238
-
239
-
240
-
241
-
242
-
243
-
244
-
245
-
246
-
247
-
248
-
249
-
250
-
251
-
252
-
253
-
254
-
255
-
256
 |
 |

42 Bank of America 2015
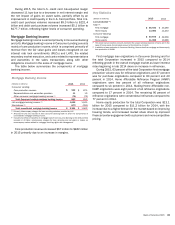
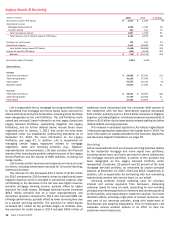
LAS Mortgage Banking Income
LAS mortgage banking income includes income earned in
connection with servicing activities and MSR valuation
adjustments, net of results from risk management activities used
to hedge certain market risks of the MSRs. The costs associated
with our servicing activities are included in noninterest expense.
LAS mortgage banking income also includes the cost of legacy
representations and warranties exposures and revenue from the
sales of loans that had returned to performing status. The table
below summarizes LAS mortgage banking income.
LAS Mortgage Banking Income
(Dollars in millions) 2015 2014
Servicing income:
Servicing fees $ 1,520 $ 1,957
Amortization of expected cash flows (1) (738) (818)
Fair value changes of MSRs, net of risk management
activities used to hedge certain market risks (2) 516 294
Total net servicing income 1,298 1,433
Representations and warranties (provision) benefit 28 (693)
Other mortgage banking income (3) 332 305
Total LAS mortgage banking income $ 1,658 $ 1,045
(1) Represents the net change in fair value of the MSR asset due to the recognition of modeled
cash flows.
(2) Includes gains (losses) on sales of MSRs.
(3) Consists primarily of revenue from sales of repurchased loans that had returned to performing
status.
In 2015, LAS mortgage banking income increased $613 million
to $1.7 billion primarily driven by a lower representations and
warranties provision and improved MSR net-of-hedge performance,
partially offset by lower servicing fees due to a smaller servicing
portfolio. Servicing fees declined 22 percent to $1.5 billion in
2015 as the size of the servicing portfolio continued to decline
driven by loan prepayment activity, which exceeded new
originations, as well as strategic sales of MSRs in 2014. The $28
million benefit in the provision for representations and warranties
for 2015 compared to a provision of $693 million in 2014 was
primarily driven by the impact of the ACE Securities Corp. v. DB
Structured Products, Inc. (ACE) decision, as time-barred claims are
now treated as resolved. For more information on the ACE decision,
see Off-Balance Sheet Arrangements and Contractual Obligations
– Representations and Warranties on page 44.
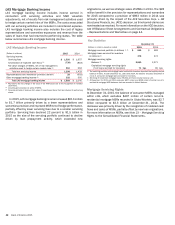
Key Statistics
December 31
(Dollars in millions, except as noted) 2015 2014
Mortgage serviced portfolio (in billions) (1, 2) $ 565 $ 693
Mortgage loans serviced for investors
(in billions) (1) 378 474
Mortgage servicing rights:
Balance (3) 2,680 3,271
Capitalized mortgage servicing rights
(% of loans serviced for investors) 71 bps 69 bps
(1) The servicing portfolio and mortgage loans serviced for investors represent the unpaid principal
balance of loans. At both December 31, 2015 and 2014, the balance excludes $16 billion of
non-U.S. consumer mortgage loans serviced for investors.
(2) Servicing of residential mortgage loans, HELOCs and home equity loans by LAS.
(3) At December 31, 2015 and 2014, excludes $407 million and $259 million of certain non-U.S.
residential mortgage MSR balances that are recorded in Global Markets.
Mortgage Servicing Rights
At December 31, 2015, the balance of consumer MSRs managed
within LAS, which excludes $407 million of certain non-U.S.
residential mortgage MSRs recorded in Global Markets, was $2.7
billion compared to $3.3 billion at December 31, 2014. The
decrease was primarily driven by the recognition of modeled cash
flows and sales of MSRs, partially offset by new loan originations.
For more information on MSRs, see Note 23 – Mortgage Servicing
Rights to the Consolidated Financial Statements.